Read this article to learn about Effect of Shift in IS or LM Curve on the Equilibrium Level of Income!
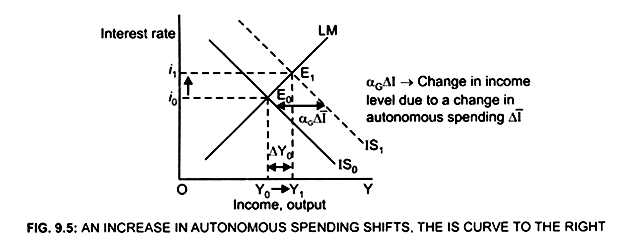
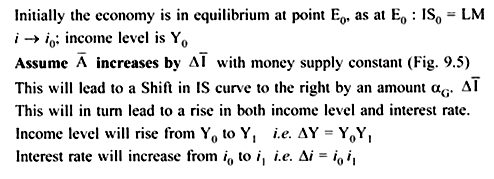
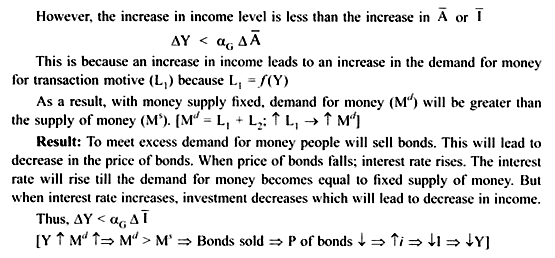
The equilibrium income level and interest rate will change when either the IS or LM curve shifts.
(a) If LM curve is positively sloped:
(b) If LM were horizontal:
In the Keynesian range (Liquidity trap region). For liquidity trap refer to 11.5.
ADVERTISEMENTS:
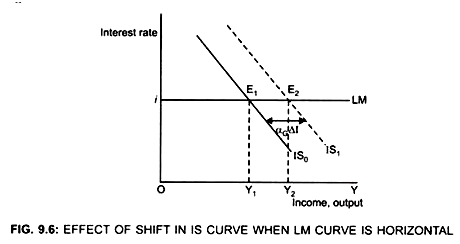
Shift in IS will have no effect on the interest rate. Only the income level will change.
∆Y = αG∆ I (Fig. 9.6)
Fig. (9.6) shows that when A changes by ∆I, IS curve shifts to the right. Income level will increase from Y1 to Y2 but interest rate remains unaffected.
ADVERTISEMENTS:
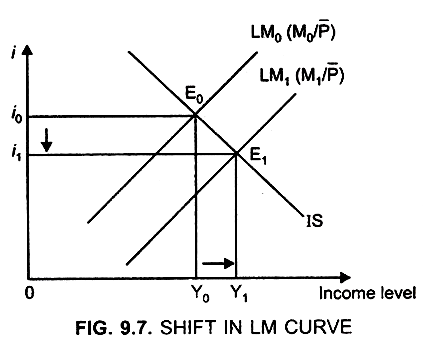
Effect of shift in LM curve on the equilibrium income level:
An expansionary monetary policy brought by an increase in money supply with price level constant will lead to shift in LM curve to the right.
Initially the product and money market is in equilibrium at point E0
at point E0: IS = LM0(M0/P)
interest rate → i0
income level → Y0
Assume:
ADVERTISEMENTS:
Money supply increases from M0 to M1, with P level constant.
LM curve will shift to the right from LM0 to LM1 Fig. 9.7.
Increase in Money supply means:
Ms > Md Md → Demand for money
ADVERTISEMENTS:
(Md = L1 + L2) Ms → Supply of money
Result:
There will be excess liquidity.
Therefore, people will buy bonds, that is, demand for bonds will increase. As stock of bond is fixed, increase in demand for bonds will lead to increase in price of bonds.
ADVERTISEMENTS:
Thus, price of bonds will increase and interest rate will decrease.
Reason: Bond price and interest rate are inversely related.
Decrease in interest rate from i0 to i1, will affect both the product and money market.

