Read this article to learn about Derivation of DAD Equation which is explained with diagrams!
Before moving to the article first thoroughly observe the diagrams.
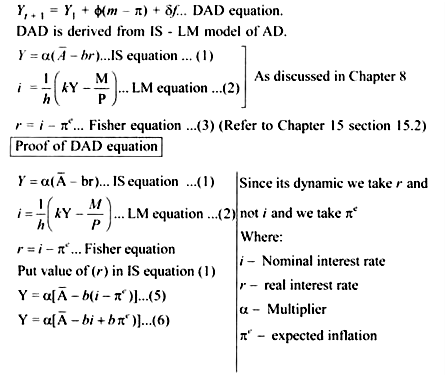
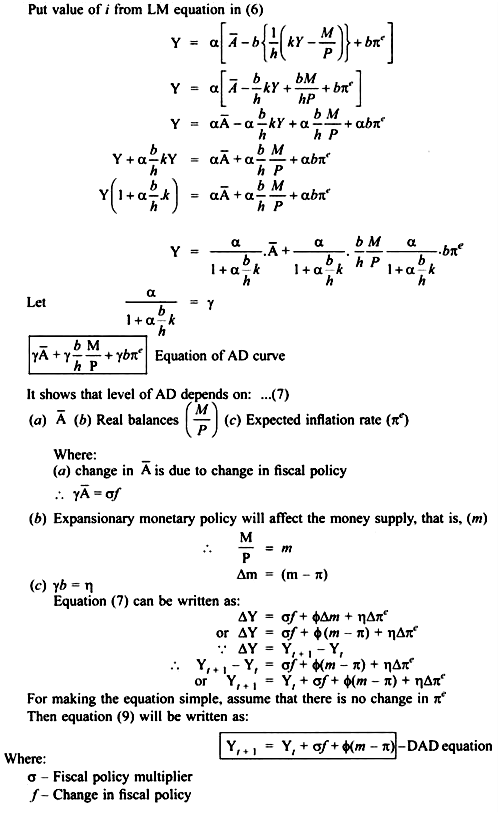
Equation (10) gives negative relationship between the level of output and thus AD and inflation rate.
DAD curve is downward sloping – DAD equation (10) shows that DAD will shift if:
(a) There is a change in fiscal policy, or
(b) If (πe) changes, or
ADVERTISEMENTS:
(c) When (m) changes
1. When fiscal policy changes:
An increase in Government spending or a cut in taxes means an expansionary fiscal policy and this will lead to an increase in AD.
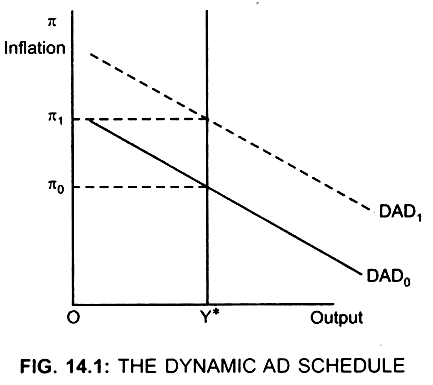
... DAD curve will shift parallel upwards from DAD0 to DAD1
2. If πe changes:
Given the growth rate of money (m), decrease in πe will lead to an increase in M/P (because price has decreased) and thus AD will increase, thus DAD curve will shift upwards to DAD1
[↓ P with m constant → M/P ↑ → ↑AD].
3. When m changes:
Given the growth rate of money (m), if inflation is low, then an increase in money supply will be greater than the increase in price. As a result real balances (M/P) will increase, the interest rate will decrease. This will lead to an increase in investment which in turn will lead to an increase in AD. Therefore, AD will be higher and DAD curve will shift upwards to DAD1 by the same amount as change in growth rate of money (∆m).
In figure (14.1),
The DAD curve shifts upwards from DAD0 to DAD1. As a result, inflation rate increases from π0 to π1.
[Shift in DAD = Change in growth rate of money]
The position of AD depends on:
ADVERTISEMENTS:
The level of output in the last period. (Y)
Higher the output level in the last period, higher is the inflation rate.
that is: if Y > Y* then πt +1 > πt
πt+1 → inflation rate in current period
ADVERTISEMENTS:
π1 → inflation rate in the last period


