
In this article we will discuss about the income and cross demand for a commodity.
Income Demand:
Let us now study income demand which indicates the relationship between income and the quantity of commodity demanded. It relates to the various quantities of a commodity or service that will be bought by the consumer at various levels of income in a given period of time, other things being equal.
Things that are assumed to remain equal are the price of the commodity in question, the prices of related commodities, and the tastes, preferences and habits of the consumer for it. The income-demand function for Quantity Demanded a commodity is written as D = f (y).
The Fig. 9 income-demand relationship is usually direct. The demand for the commodity increases with the rise in income and decreases with the fall in income, as shown in Figure 9. When income is OI, the quantity demanded is OQ and when income rises to OI1 the quantity demanded also increases to OQ1. The reverse case can also be shown likewise. Thus, the income demand curve ID has a positive slope. But this slope is in the case of normal goods.
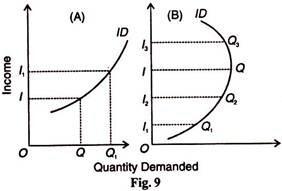
Let us take the case of a consumer who is in the habit of consuming an inferior good. So long as his income remains below a particular level of his minimum subsistence, he will continue to buy more of this inferior good even when his income increase by small increments. But when his income starts rising above that level, he reduces his demand for the inferior good.
In Figure 9(B), OI is the minimum subsistence level of income where he buys IQ of the commodity. Upto this level, this commodity is a normal good for him so that he increases its consumption when his income rises gradually from OI1 to OI2.
As his income rises above OI, he starts buying less of the commodity. For instance, at OI3 income level, he buys I3Q3 which is less than IQ. Thus, in the case of inferior foods, the income demand curve ID is backward sloping.
Cross Demand:
Let us now take the case of related goods and how the change in the price of one affects the demand of the other. This is known as cross demand and is written as D = f (pr). Related goods are of two types, substitutes and complementary. In the case of substitute or competitive goods, a rise in the price of one good A raises the demand for the other good B, the price of B remaining the same.
ADVERTISEMENTS:
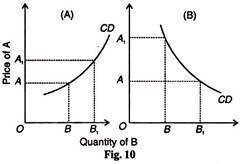
The opposite holds in the case of a fall in the price of A when the demand for B falls. Figure 10 (A) illustrates it. When the price of good A increases from OA to OA1 the quantity of good B also increases from OB to OB1. The cross demand curve CD for substitutes is positively sloping.
For with the rise in the price of A, the consumers will shift their demand to B since the price of B remains unchanged. It is also assumed here that the incomes, tastes, preferences, etc., of the consumers do not change.
In case the two goods are complementary or jointly demanded, a rise in the price of one good A will bring a fall in the demand for good B. Conversely, a fall in the price of A will raise the demand for B. This is illustrated in Figure 10 (B) where when the price of A falls from OA1 to OA, the demand for B increases from OB to OB1. The demand curve in the case of complementary goods is negatively sloping like the ordinary demand curve.
If, however, the two goods are independent, a change in the price of A will have no effect on the demand for B. We seldom study the relation between two unrelated goods like wheat and chairs. Mostly as consumers, we are concerned with the price-demand relation of substitutes and complementary goods.