
Read this article to learn about the top fifteen frequently asked questions on Demand and Supply of a Commodity.
Q. 1. Why is a Product Demand Curve Negative Sloping?
Ans. For a normal, non-Giffen goods, demand curve slopes downwards from left to right because of three reasons.
First is the law of diminishing marginal utility. Second is the substitution effect, while the third reason is the income effect of price change.
ADVERTISEMENTS:
Q.2. Draw an Unusual Demand Curve and Explain why you consider it an unusual.
Ans. In some unusual cases, demand curve becomes upward rising indicating a direct relationship between the price and quantity demanded. In figure 17.2, we have drawn positive sloping demand curve, DD1 for goods X. As price rises from OP1 to OP2, quantity demanded also increases from OX1 to OX2.
This may happen in cases of:
(i) Giffen goods,
ADVERTISEMENTS:
(ii) Conspicuous consumption goods, etc.

Q.3. Give Reasons Why Demand Curve Slopes Upwards.
Ans. The demand curve slopes upwards in the case of conspicuous consumption goods, Giffen goods, etc. People buy conspicuous consumption goods, particularly when their price rises, merely to display their riches.
ADVERTISEMENTS:
Further, Sir Robert Giffen found that the Irish people during the 19th century famine in Ireland, consumed more of potatoes when its price was higher than meat. Here, potato is a Giffen good. Again, in the share market, people buy share more (or less) when its price rises (or falls).
Q.4. Demand for a Commodity Depends on the Price of that Commodity. Are there any Factors that affect the Demand for a Commodity?
Or
What is the Demand Function?
Ans. The law of demand establishes the functional relationship between the quantity demanded of a goods and its price. However, demand for any commodity depends not only on the price of that commodity, but also on other factors. So, the demand function can written as.
DX = f(PX, Pa …Pc, Y, T, E, N)
DX = demand for goods X; f = functional relationship;
PX = price of goods X;
Q.5. Make a Distinction between a Change in Demand and a Change in Quantity Demanded.
ADVERTISEMENTS:
Ans. Change in demand refers to an increase or a decrease in demand following a change in one of the determinants of demand other than the own price. Consequently, the demand curve will shift (upward or downward).
On the other hand, a change in quantity demanded refers to a rise or fall in demand following a change in own price, assuming other things constant. So, a change in quantity demanded refers to a movement along the same demand curve.
Q.6. Point out the factors leading to a change in demand.
Or
ADVERTISEMENTS:
How does the position of a demand curve change?
Ans. Causes of change in demand are numerous.
They are:
(i) Change in income and wealth of the consumer,
ADVERTISEMENTS:
(ii) Change in tastes and preferences of the consumer,
(iii) Change in the prices of substitute and complementary goods,
(iv) Change in the number of buyers,
(v) Anticipation of consumers about a future change in prices,
(vi) Change in the pattern of income distribution,
(vii) Advertisement,
ADVERTISEMENTS:
(viii) Governmental taxation policy,
(ix) Change in climatic condition (e.g., increase in demand for woolen garments during winter weather), etc.
Q.7. Define price elasticity of demand.
Ans. Price elasticity of demand is defined as the ratio of the proportionate change in quantity demanded to the proportionate change in own price. Thus,
Ep = % change in quantity demanded (∆Q/Q)/% change in price (∆P/P)
Q.8. Define Income Elasticity of Demand.
ADVERTISEMENTS:
Ans. Income elasticity of demand is defined as the ratio of the proportionate change in quantity demanded to a proportionate change in income. Thus,
EM = % change in quantity demanded (∆Q/Q)/% change in price (∆M/M)
Or EM = ∆Q/Q ÷ ∆M/M = ∆Q/M.M/Q
Q.9. Mention the Different Types of Elasticity of Demand.
Ans. As the rate of change in price and consequently the rate of change in quantity demanded is not the same for all types of goods, we find different degrees of price elasticity of demand.
These are:
ADVERTISEMENTS:
(i) Elastic demand,
(ii) Inelastic demand,
(iii) Unitary elasticity of demand,
(iv) Perfectly elastic demand, and
(v) Perfectly inelastic demand.
Q. 10. Would the elasticity of demand be the same at all the points of a linear demand curve?
ADVERTISEMENTS:
Or
At which point on a downward sloping straight line demand curve the absolute value of the price elasticity is unity?
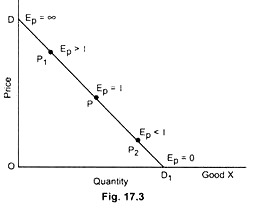
Ans. Elasticity of demand is not the same at all points of a straight line demand curve. At the middle point of the curve, elasticity of demand is equal to unity. In Figure 17.3, DD1 is the demand curve. At point P, EP (price elasticity of demand) = 1. At P1, it is elastic (EP >1).
As we move upwards along the demand curve from the mid-point, elasticity of demand rises and becomes perfectly elastic at point D (i.e., EP = ∞). Further, as we move downwards along the mid-point, elasticity of demand declines (i.e., at P2 it becomes inelastic) and becomes perfectly inelastic at D1 (i.e., EP= 0).
Q. 11. What will be the Shape of a Demand Curve if Coefficient of Elasticity of Demand is Unity at all of its points?
Ans. If the change in price and change in demand is proportionate, the demand is said to be unitary elastic. The coefficient of elasticity of demand is one. The demand curve becomes a rectangular hyperbola (Fig. 17.4). The curve in which every rectangle is equal to every other (rectangle OPRQ= rectangle OP1R1Q1) is known as a rectangular hyperbola.

Q. 12. What will be the Coefficient of Elasticity of Demand when a Fall in Price Leads to an Increase, Decrease and no change in Total Outlay?
Ans. If the fall in price of a commodity cause consumer’s outlay to increase, the demand becomes elastic.
Secondly, if the fall in price leads to a fall in consumer’s expenditure, demand becomes inelastic.
Finally, the coefficient of elasticity of demand becomes zero when changes in price do not cause any change in total consumer’s outlay.
Q. 13. The elasticity of demand for a commodity is unity. If the price of a commodity is Rs. 4, the demand for it is 300 units. If the price drops down to Rs. 3 how will the demand react?
Ans. If the change in price does not lead to any change in consumer’s total expenditure, elasticity of demand is everywhere equal to unity. Before change in price, total outlay is Rs. 4 × 300 units = Rs. 1,200. As price drops from Rs. 4 to Rs. 3. total demand increases to 400 units. So, the total expenditure after the fall in price becomes Rs. 3 × 400 units = Rs. 1,200. Hence, no change in total expenditure.
Q.14. If the price of tea falls, how will the demand for sugar be affected? How will the demand for coffee be affected?
Ans. Normally, tea and sugar are complementary to each other and tea and coffee are considered as substitutes. As price of tea falls, its demand will increase and, hence, demand for its complementary good, sugar, will also increase. Oppositely, as price of tea falls, tea becomes cheaper and coffee becomes expensive. Naturally, demand for coffee will go down.
Q.15. Explain three important factors on which elasticity of demand for a product depends.
Ans. Whether the elasticity of demand for a product is elastic or inelastic depends on the:
(i) Nature of commodities,
(ii) Range of substitutes, and
(iii) Product consumed out of habits.
Firstly, in the case of necessary goods, elasticity of demand is inelastic while in the case of luxury commodity it is elastic.
Secondly, a commodity having a large number of substitutes will be relatively elastic.
Finally, the demand for some goods (cigarette) becomes inelastic as these goods are consumed by people out of habit.
Read this article to learn about the most frequently asked questions on Basic of Demand and Supply.
Q.16. Define Cross Elasticity of Demand.
Or
If cross price elasticity of two related goods is positive, what is the relationship between the aforesaid goods?
Ans. The cross elasticity of demand measures the relative responsiveness of quantity demanded of a given commodity to a change in the price of a related commodity, i.e., substitute and complementary goods. Formula for the cross elasticity of demand is
EXY = % change in the demand for X/% change in the price for Y
Here, X and Y are related commodities. If these two are substitute goods, cross elasticity of demand will be positive. Oppositely, in the case of complementary goods, cross elasticity of demand will be negative.
Q.17. What will be the coefficient of income elasticity of demand in the case of (i) necessary goods, (ii) luxury goods, and (iii) inferior goods?
Ans. The coefficient of income elasticity of demand is less than one (i.e., inelastic) in the case of necessary goods, greater than one (i.e., elastic) in the case of luxury goods, and negative in the case of inferior goods.
Q.18. What is the significance of negative income elasticity of demand?
Ans. If the income elasticity of demand for a goods is negative then such commodity is described as “inferior goods.”
Q.19. If demand is elastic how will total revenue change if price falls?
Ans. If the fall in the price of a commodity causes consumer’s total outlay to increase then demand is said to be elastic.
Q.20. (a) Suppose the price of sugar comes down from Rs. 5 per kilogram to Rs. 4 and the demand for sugar increases from 1,000 quintals to 1,500 quintals. Is it a case of elasticity of demand or a change in demand?
(b) Suppose the price of sugar does not change but the quantity demanded increases from 1,000 quintals to 1,500 quintals. Is it a case of elasticity of demand or a change in demand?
Ans. (a) It is a case of own price elasticity of demand.
(b) It is a case of change in demand since own price of sugar remains unchanged while other determinants of demand for sugar change.
Q.21. What are the determinants of supply of a commodity?
Ans. Law of supply shows the direct relationship between the price and supply of a commodity. Thus, supply of a commodity depends on the price of that commodity. In addition to price, there are other determinants of supply of a commodity.
They are shown in the form of a supply function equation:
SX = f(PX, Pa…PC, PL…PO, T, G, ST)
where, SX = supply of X,
PX = price of X,
Pa.. .Pc = prices of the other goods related to X,
PL… PO = prices of inputs,
T = time
G = nature of the commodity, and
ST = technology.
Q.22. What does a normal-shaped supply curve indicate?
Ans. The relationship between price and supply of a commodity is a direct one—higher the price, greater the supply, and, lower the price, the smaller the supply. Thus, the supply curve is upward rising.
Q.23. Mention why supply curve is upward rising.
Ans. The two forces behind the upward sloping supply curve are:
(i) The law of diminishing marginal returns, and
(ii) The profit maximisation motive of the producer.
Normally, if output is increased by employing more variable inputs, beyond a certain limit, the return from these inputs diminishes or the cost of production for using these resources increases. So, unless the price of a commodity is high, it will not be produced or supplied in greater quantity. If price increases, profit per unit increases. Naturally, larger quantities will be produced and supplied at the higher price.
Q.24. Draw an abnormal supply curve and explain why it is not normal-shaped.
Ans. Supply curve for goods which cannot be produced (e.g., paintings of a dead painter) becomes a vertical straight line. Supply curve for perishable commodities also takes this shape. Here SS curve, drawn in Fig. 17.5, is the supply curve for such commodity whose quantity remains unchanged at all prices.

Q.25. Make a Distinction between a Change in Supply and a Change in Quantity Supplied.
Ans. Change in supply refers to an increase or decrease in supply following a change in one of the determinants of supply, other than own price. Such a change involves a shifting of the supply curve in the rightward or in the backward direction. On the other hand, a change in quantity supplied means that the supply will expand at higher price and contract at lower prices, assuming other things remaining constant. Here, such a change involves a movement along the same supply curve.
Q.26. What are the causes of change in supply?
Ans. A change in supply occurs when:
(i) Prices of related goods change,
(ii) Prices of inputs change,
(iii) Production technique changes,
(iv) Mode of transportation of goods changes,
(v) Taxation policies of the government change,
(vi) Climatic condition (especially for agricultural products) changes, etc.
Q.27. Define elasticity of supply.
Ans. Elasticity of supply is defined as the percentage change in quantity supplied by the percentage change in price. Symbolically, elasticity of supply (ES) is
ES = % change in quantity supplied (∆Q/Q)/% change in price (∆P/P)
ES = ∆Q/Q ÷ ∆P/P = ∆Q/∆P.P/Q
Q.28. Show that price does not change if demand increases and supply is perfectly elastic and that quantity does not change if demand increases and supply is perfectly inelastic.
Ans. In Figure 17.6, PS is the perfectly elastic supply curve. Intersection point between demand curve, DD, and supply curve, PS, determines equilibrium price OP. Now if demand increases to D1D1 quantity will rise to OQ1, but the price remains the same (OP). On the other hand, if supply curve is perfectly inelastic, QS, then increase in demand from DD to D1D1 causes price to increase to OP1, but the equilibrium quantity remains the same (OQ).

Q.29. Determine equilibrium price by drawing demand and supply curves. What will happen to equilibrium price if (a) only demand increases, (b) only supply increases, and (c) both demand and supply?
Ans. (a) Suppose DD is the original demand curve and SS is the supply curve (Fig. 17.7). Point E is the equilibrium point. So, equilibrium price becomes OR Now if demand increases to D1D1, new equilibrium point will be E1. Thus, equilibrium price rises from OP to OP1.

(b) SS is the initial supply curve intersecting demand curve DD at point E (Fig. 17.8). Thus, equilibrium price is OP. As supply increases supply curve shifts to S1S1. This new supply curve cuts the demand curve at E1. Accordingly, price declines from OP to OP1.

(c) If both demand and supply increase, equilibrium price may increase, decrease or remain the same.