The following points highlight the two ways by which changes in demand takes place. The ways are: 1. Increase and Decrease in Demand 2. Extension and Contraction in Demand.
Way # 1. Increase and Decrease in Demand:
An individual’s demand curve is drawn on the assumption that factors such as prices of other commodities, income and tastes influencing his demand remain constant. What happens to an individual’s demand curve if there is a change in any one of the factors affecting his demand, the other factors remaining constant?
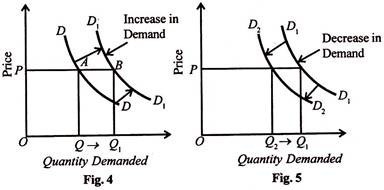
When any one of the factors changes, the entire demand curve shifts either to the right or to the left when the consumer buys more of the commodity at the same price, it is increase in demand. When his money income rises, other factors remaining constant, his demand curve for a commodity will shift to the right. This is shown in Figure 4.
Before the rise in his income, the consumer is buying OQ quantity at OP price on the DD demand curve. With the increase in income, his demand curve shifts to the right as D1D1. He now buys more quantity OQ1 at the same price OP. On the contrary, if his income falls, his demand curve will shift to the left.
ADVERTISEMENTS:
He will buy less of the commodity at the same price, as shown in Figure.5. Before the fall in his income, the consumer is on the demand curve D1D1 where he is buying OQ2 of the commodity at OP price. He now buys less quantity OQ2 at the given price OP. When the consumer buys less of the commodity at a given price, this is called the decrease in demand.
Demand curves are thus not stationary. Rather, they shift to the right or left due to a number of causes. There are changes in tastes, habits and customers of the consumers; changes in income and expenditure; changes in the prices of substitutes and complements; expectations about future in prices and incomes and changes in the age and composition of the population, etc.
Way # 2. Extension and Contraction in Demand:
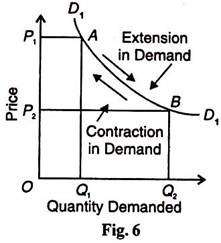
A movement along a demand curve takes place when there is a change in the quantity demanded due to a change in the commodity’s own price and not due to any other factor. This is illustrated in Figure 6, which shows that when the price is OP1, the quantity demanded is OQ1. With the fall in price, there has been a downward movement along the same demand curve D1D1 from point A to B.
ADVERTISEMENTS:
This is known as extension in demand. On the contrary, if we take B as the original price-demand point, then a rise in the price from OP2 to OP1 leads to a fall in the quantity demanded from OQ2 to OQ1. The consumer moves upwards along the same demand curve D1D1 from point B to A. This is known as contraction in demand.