Effects of Changes in Autonomous Expenditure under Short Run Equilibrium (with diagram)!
The equilibrium output and aggregate demand at fixed price and constant interest rate is derived by solving the equation Y = A/I-b. Clearly, value of Y will depend on values of A (i.e., C and I) and b (i.e., MPC).
Thus, if there is change in values of C (autonomous consumption) or I (autonomous investment), it will cause change in equilibrium output and aggregate demand. Since at equilibrium, level of income is fixed and so consumption is fixed, we, therefore, assume that change in demand function is due to change in investment. Let us take the above numerical of section 8.15 wherein C = 60, 1 = 15 and b = 0.8, then
Now keeping autonomous consumption constant, we increase value of autonomous investment from 15 to 20. The equilibrium output is
Clearly, with increase in investment from 15 to 20, equilibrium output has increased from 375 to 400. The reason for higher increase in equilibrium output than increase in investment is multiplier effect because change in investment (DI) causes multiple change in income (DY).
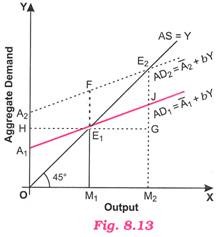
The above situation is depicted in Fig. 8.13 in which 45° line shows AS = Y and AD, line indicates C + I (or A1 + bY). 45° line represents points at which aggregate demand and output are equal. Initially, AD1 line intersects 45° line at E1 at which equilibrium values of output and aggregate demand are OM1 and E1M1 respectively.
When autonomous investment increases (from 15 to 20), AD1 line shifts upward and assumes the position of A2 line which intersects 45° line at E2 making it a new equilibrium point. In Fig. 8.13 the value of aggregate demand at OM1 is M1F which is greater than M1E1 by amount E1F. Thus, E1F measures the amount of excess demand. The new equilibrium values of output and aggregate demand are OM2 and M2E2 respectively. They are greater than their initial values because of investment multiplier effect.


