Market equilibrium refers to the stage where the quantity demanded for a product is equal to the quantity supplied for the product.
The price when the quantity demanded is equal to the quantity supplied for the product is known as equilibrium price.
Equilibrium price is also termed as market clearing price, which is referred to a price when there is neither an unsold stock nor an unsupplied demand.
The market price refers to a current price at which a product is sold in the market. It is determined by the collaboration of two functions, namely, demand and supply. According to economic theory, the market price of a product is determined at a point where the forces of supply and demand meet. The point where the forces of demand and supply meet is called equilibrium point. Conceptually, equilibrium means state of rest. It is the stage where the balance between two opposite functions, demand and supply is achieved.
ADVERTISEMENTS:
Let us understand the concept of market equilibrium with the help of an example.
Table-10 shows the market demand and supply for talcum powder in Mumbai with their varying prices of a week:
Determination of Market Price:
ADVERTISEMENTS:
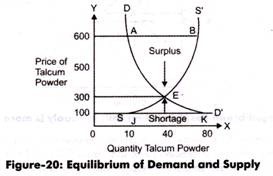
The equilibrium price of a product is determined when the forces of demand and supply meet. For understanding the determination of market equilibrium price, let us take the example of talcum Powder shown in Table-10. In Table-10 we have taken the initial price of talcum powder as Rs. 100.
In this case, the quantity demanded is 80,000, while the supply is 10,000. This results in the shortage of 70,000 of talcum powder in the market. Due to this shortage, the sellers get a chance to earn more by increasing the price of the talcum powder and consumers are ready to purchase at the price quoted by sellers due to shortage of talcum powder.
This increase in profit results in increase in the production of a product to earn more profit, which, in turn, increases the supply of the product. The process of increase in prices goes on till the price of talcum powder reaches to Rs. 300. At this price, the demand and supply is equal to 40,000. Therefore, equilibrium is achieved and the equilibrium price is Rs. 300.
Similarly, if the supply of talcum powder increases beyond Rs. 300, then the sellers need to decrease their prices to sell their unsold stock. They would also stop production that results in the decrease in supply. In such a case, consumers would buy more due to reduction in price of talcum powder. This would continue till the stock would achieve equilibrium and the equilibrium price come out to be Rs. 300.
ADVERTISEMENTS:
The graphical representation of equilibrium of demand and supply is shown in Figure-20:
Shifts in Market Equilibrium:
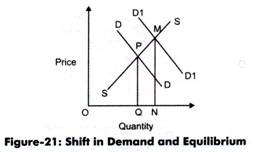
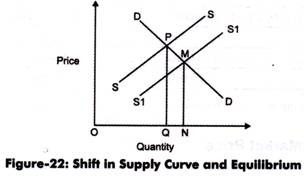
If there is a shift in supply or demand curve, then the equilibrium point also gets shifted.
The shift in demand curve and equilibrium is shown in Figure-21:
In Figure-21, initially the equilibrium price is found at PQ and quantity at OQ. However, when the demand curve shifted from DD to D1D1, then equilibrium also shifts from PQ to MN. Now, the equilibrium price is at MN and the quantity is at ON. In this case, the supply does not show any changes. It can also be interpreted from Figure-21 that the equilibrium price has increased with an increase in quantity, when demand curve shifts.
The shift in supply curve and equilibrium is shown in Figure-22:
In Figure-22, initially the equilibrium price is found at PQ and quantity at OQ. However, when the supply curve shifted from SS to S1S1, then equilibrium also shifts from PQ to MN. Now, the equilibrium price is at MN and the quantity is at ON. In this case, the demand does not show any changes. It can also be interpreted from Figure-22 that the equilibrium price has decreased and quantity has increased, when supply curve shifts.
ADVERTISEMENTS:
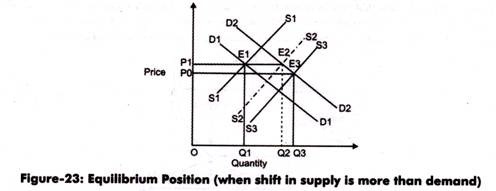
Now, let us determine the effect of simultaneous shifts in the demand and supply curve on the equilibrium point. It basically depends on the extent of shift in the demand and supply curves. In case the shift in supply curve is greater than the demand curve, then equilibrium price decreases and output increases.
It can be better explained with the help of Figure-23:
In Figure-23, initially equilibrium position. E1 is obtained by balancing demand curve, D1D1 and supply curve, S1S1. Equilibrium price at E1 is P1 and quantity is OQ1. When the demand curve shifts from D1D1 to D2D2 and supply curve shifts from S1S1 to S3S3, then equilibrium also shifts from E1 to E3.
ADVERTISEMENTS:
In this case, supply shift is greater than the shift in demand; therefore, equilibrium price falls down to PO and output increases to OQ3. However, if the shift in demand and supply curve is equal that is D2D2 and S2S2 respectively, then the equilibrium price remain constant and output increases to Q2.
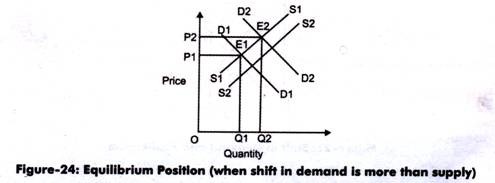
In case, shift in demand curve is greater than the shift in supply curve, then the both, equilibrium price and quantity, increase, as shown in Figure-24:
In Figure-24, initially equilibrium position, E1 is obtained by balancing the demand curve, D1D1 and supply curve, S1S1. Equilibrium price at E1 is P1 and quantity is OQ1. When the demand curve shifts from D1D1 to D2D2 and supply curve shifts from S1S1 to S2S2, then equilibrium also shifts from E1 to E2. In this case, demand shift is greater than the shift in supply; therefore, equilibrium price increases to P2 and output increases to OQ2.

