It is important to know the relationship between demand function and demand curve.
While a complete demand function specifies the relationship between quantity demanded of a product and many variables such as the own price of the product, income of consumers prices of related commodities, tastes and preferences, expected future prices etc.
(Qxd )= f (Px, I, Px, T, A, N) the demand curve is a graphic representation of only a part of this demand function, namely, Qxd = f(P), holding other independent variables in the demand function as constant.
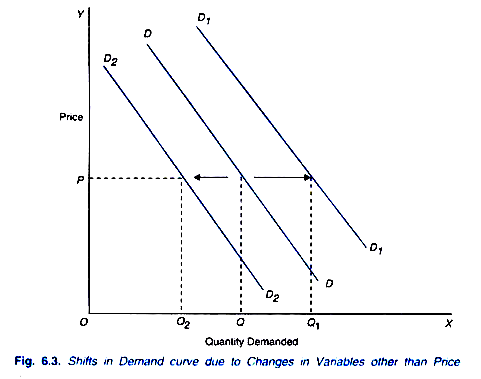
That is, while drawing a demand curve values of other variables in the demand function are kept constant at particular levels. The complete demand function with many variables cannot be shown by the two dimensional curve, the effect of changes in other variables or factors on the quantity demanded of a product is shown by shifts in the whole demand curve. This is illustrated in Figure 6.3. To begin with DD is the market demand curve.
Now, suppose income of consumers increases, say due to the hike in their wages and salaries. As a result, they will demand more of a product at each price causing a shift in the demand curve to the right as from DD to D1D1 in Figure 6.3.
It will be seen that at a given price OP, with demand curve DD the consumers were buying OQ quantity of the product and with rightward shift in the demand curve to D1D1 they demand greater quantity OQ1 of the product. Similarly, at other prices more is demanded at D1D1 as compared to the demand curve DD.
Similarly, increase in price of a substitute of a product, favourable change in preferences of consumers for a product, expectations of rise in price of a product in future will cause increase in the quantity demanded of a product and will therefore lead to the shift in demand curve for the product to the right.
On the other hand, decrease in consumers’ income fall in price of a substitute product, unfavourable change in consumers’ preference for the product, aggressive advertisement expenditure by competitive firms will cause a decrease in demand for the product resulting in leftward shift in the demand curve from DD to D2D2. With lower demand curve D2D2 at each price consumers will demand less quantity of the product than before. Thus at price OP on demand curve D2D2 the consumers would now demand OQ2 quantity of the product which is smaller than OQ.
ADVERTISEMENTS:
To conclude, whereas demand function specifies relationship between quantity demanded of a product with many independent variables, demand curve of a product is a graphic representation of only a part of the demand function with price of the product as the only independent variable. The effects of change in variables other than price, as explained above, are shown through a shift in the demand curve.
