
1. Introduction to Ratio Analysis
Ratio analysis is a widely used tool of financial analysis. It is defined as the systemic use of ratio to interpret the financial statements so that the strengths and weaknesses of a firm, as well as its historical performance and current financial condition, can be determined.
Ratios make the related information comparable. A single figure by itself has no meaning but when expressed in terms of related figures it yields significant inferences. Thus ratios are relative figures reflecting the relationship between related variables.
Their use, as tools of financial analysis, involves their comparison as single ratios like absolute figures are not of much use. A ratio is quotient of two numbers and is an expression of relationship between the figures which are not of much use.
A ratio is a quotient of two numbers and is an expression of relationship between the figures or two amounts.
ADVERTISEMENTS:
It indicates a quantitative relationship which is used for a qualified judgment and decision making. The relationship between two accounting figures is known as accounting ratio. These may be compared with the previous year or base year ratios of the same firm. Ratios indicate the relationship between profits and capital employed. Ratios may be expressed in 3 forms – (a) as quotient 1:1 or 2:1 etc.; (b) as a rate, i.e., inventory turnover as a number of times in year and (c) as a percentage. Ratio analysis is useful to shareholders, creditors and executives of the company.
2. Care in Use of Ratios
To get better result ratio analysis is required to be done with care as several factors affect the efficacy of ratios.
These factors are given below:
(1) Type of business under consideration affects the ratios and conclusions drawn from them. For example a high ratio of debt to net worth can be expected of a public utility company operating with large fixed assets with social benefits consideration.
ADVERTISEMENTS:
(2) Seasonal character of the business affects ratios for a particular type of industry or enterprise. For example inventory to sales ratio for a grain merchant during the peak season has a different meaning and is supposed to be much higher than during other periods of the same year.
(3) Quality of assets also affects the ratio analysis and gives different interpretations to different business enterprises.
Current assets to current liabilities ratio mostly 2:1 is considered more satisfactory for a liquid position of the company but if with the same proportion of assets acid test ratio is calculated it may give a different result and may depict the unsatisfactory proportion of availability of liquid funds with the company to meet its most urgent and pressing obligation.
(4) Adequacy of data is another consideration for comparison of particular factors with each other. For example average collection period for Bill Receivable for a particular month may differ to those with other months or the average of the year. Another consideration would be whether Bill Receivable has been properly valued for a particular period as over valuation may render the ratio incomparable.
ADVERTISEMENTS:
(5) Modification of ratios reflects only the past performance and must be modified by future trends of business.
(6) Interpretation of ratios should be relied upon in isolation and should be considered with accounting documents for interpretations.
(7) Non-financial data ratios based on financial data of firms should be considered with non-financial data to supplement the financial ratios that give better interpretation.
3. Types of Ratios
Ratios can be broadly classified into four groups:
1. Liquidity ratios;
2. Capital Structure / Leverage ratios;
3. Profitability ratios and
4. Activity ratios.
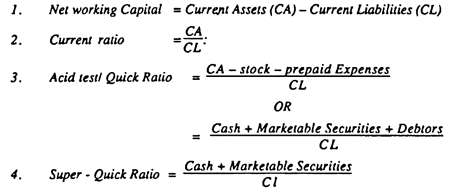
1. Liquidity Ratios:
ADVERTISEMENTS:
Liquidity is a prerequisite for the very survival of a business unit. Liquidity represents the ability of the business concern to meet short-term obligations when they fall due for payment. Hence the maintenance of adequate liquidity in any business concern cannot be over emphasized.
The liquidity ratio measures the ability of the business concern to meet its short-term obligations and reflects the short-term solvency of the unit.
Important Liquidity Ratios:
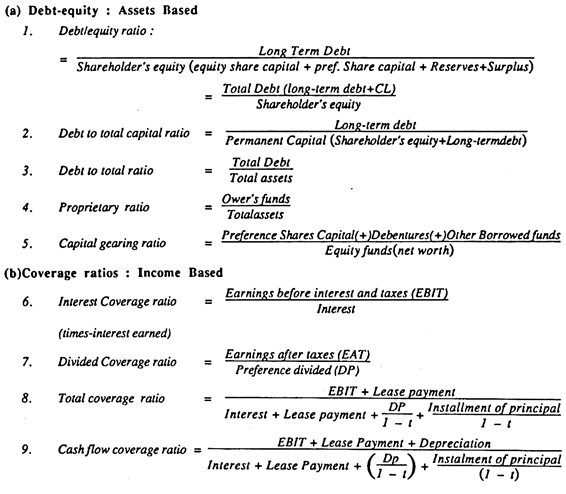
2. Capital Structure/Leverage Ratios:
ADVERTISEMENTS:
The second category of financial ratio is Leverage or Capital structure ratios. The short-term Creditors would use leverage ratios for ascertaining the current financial position of the business unit.
The long-term would use leverage or capital structure ratio to examine the long term solvency of the business unit. The leverage ratio reflects the capacity of the business unit. The leverage ratios reflect on the capacity of the business unit to assure long term creditor as regards to periodic payment of interest during the period of the loan as well as repayment of principal on maturity.
There are two aspects of the long term solvency of a unit as reflected in its policy to repay the principal on maturity and pay interest at periodic intervals. These two aspects are mutually dependent and interrelated and give rise to two types of leverage ratios.
The first type of leverage ratios which are based on the relationship between borrowed funds and owner’s capital and computed from the balance sheet include many variations such as
ADVERTISEMENTS:
(i) debt equity ratio,
(ii) proprietary ratio,
(iii) equity-asset ratio.
The second type of leverage ratio which are also referred to as “Coverage ratios” computed from the Profit and Loss Account include many variations such as
(i) interest coverage ratio,
(ii) dividend coverage ratio and
ADVERTISEMENTS:
(iii) total fixed charges coverage ratio.
Important Leverage/Capital Structure Ratios:
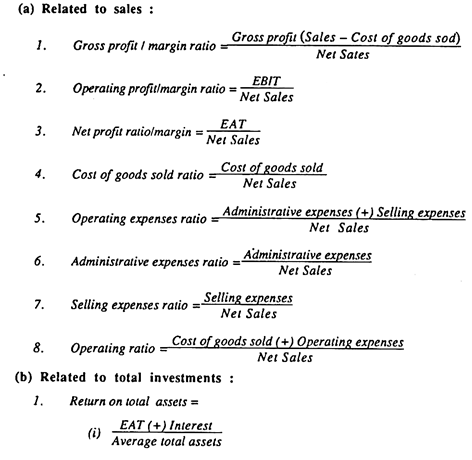
3. Profitability Ratios:
The Profitability of any organization is very essential and serves as an incentive to achieve efficiency. Thus the management of any business organizations strives to measure the operating efficiency of that organization to ensure optimum profitability on its investment. The profitability ratios are designed to measure the profitability of any organization.
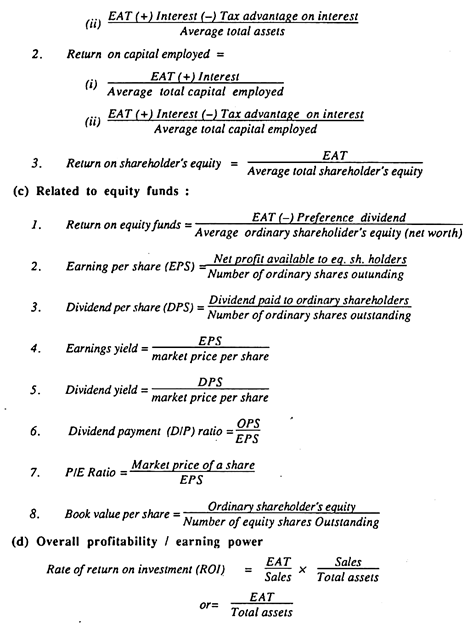
In other words these ratios indicate the units’ efficiency of operation. Profitability ratios can be divided into two categories i.e. showing profitability either in relation to sales or in relation to investments.
Important Profitability Ratios:
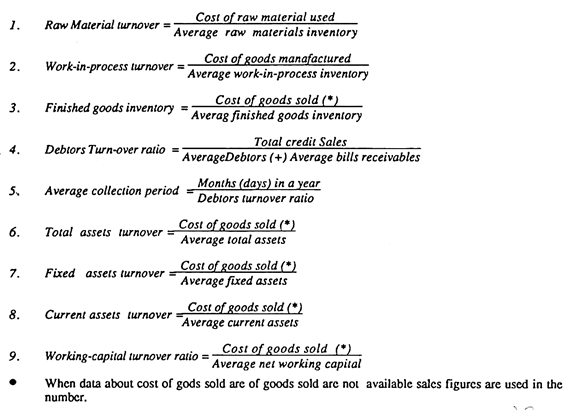
4. Activity/Turnover/Efficiency Ratios:
ADVERTISEMENTS:
The last category of ratios is the activity ratios. They are also known as the efficiency or turnover ratios. Such ratios are concerned with measuring the efficiency in asset management. The efficiency with which assets are managed / used is reflected in the speed and rapidity with which they are converted into sales.
Thus the activity ratios are a test of relationship between sales / cost of goods sold and assets.
Depending upon the type of asset, activity ratios may be (i) inventory / stock turnover, (ii) receivable / debtor’s turnover and (iii) total assets turnover. The first of these indicates the number of times inventory is replaced during the year, of how quickly the goods are sold. It is a test of efficiency inventory management. The second category of turnover ratio is indicative of the efficiency of receivables management as it shows how quickly trade goods are sold. It reveals the efficiency in managing and utilizing the total assets.
Important Activity / Turnover / Efficiency Ratios:
4. Advantages of Ratio Analysis
The special advantage of working out accounting ratios is that performance and financial position can be properly judged.
ADVERTISEMENTS:
Following are some important advantages of ratio analysis:
(i) Decision-making process.
(ii) Diagnosis of financial ills.
(iii) Evaluation of financial performances
(iv) Short and long term planning.
(v) Study of financial trends;
5. Limitations of Ratio Analysis
1. Reliability of ratio depends upon the reliability of the original data / information collected.
ADVERTISEMENTS:
2. Increases, decreases and constant changes in the price distort the comparison over period of years
3. The benefits of ratio analysis depends on correct interpretation. Many times it is observed that due to small errors in original data it leads to false conclusions.
4. A ratio-analysis is not an ultimate yardstick for assessing the performance of the firm.5. If there is window-dressing then the ratios calculated will fail to give the correct picture and it will be mismanagement.