Law of diminishing returns explains that when more and more units of a variable input are employed on a given quantity of fixed inputs, the total output may initially increase at increasing rate and then at a constant rate, but it will eventually increase at diminishing rates.
In other words, the total output initially increases with an increase in variable input at given quantity of fixed inputs, but it starts decreasing after a point of time.
The law of diminishing returns is described by different economists in different ways, which are as follows:
According to G. Stigler, “As equal increments of one input are added; the inputs of other productive services being held, constant, beyond a certain point the resulting increments of product will decrease, i.e., the marginal product will diminish.”
ADVERTISEMENTS:
According to F. Benham, “As the proportion of one factor in a combination of factors is increased, after a point, first the marginal and then the average product of that factor will diminish.”
In the words of Alfred Marshall, “An increase in the Capital and Labour applied in the cultivation of land causes, in general, less than proportionate increase in the amount of produce raised unless it happens to coincide with an improvement in the art of agriculture.”
The assumptions made for the application of law of diminishing returns are as follows:
i. Assumes labor as an only variable input, while capital is constant
ADVERTISEMENTS:
ii. Assumes labor to be homogeneous
iii. Assumes that state of technology is given
iv. Assumes that input prices are given
Let us understand the law of diminishing returns with the help of an example. Suppose a mining organization has machinery as the capital and mine workers as the labor in the short-run production. For increasing the level of production, it can hire more workers.
ADVERTISEMENTS:
In such a case, the production function of the organization would be as follows:
Q = f (L), K
Where K is constant
The production function for labor-output relation is assumed to be:
Qc = -L3 + 30L2 + 20L
The different values of Qc can be obtained by substituting different values of L in the equation of production function.
For example, if L is 10, then the value of Q would be as follows:
Qc = – 103 + 30(10)2 + 20(10)
Qc = 2200
ADVERTISEMENTS:
Similarly, different values of Qc can be obtained for different values of L.
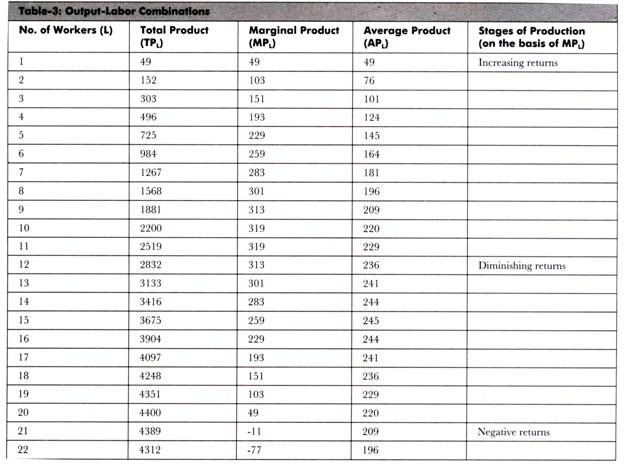
This output-labor relationship can be represented in the tabular form of a production function, which is shown in Table-3:
In Table-3, total product represents the value of Q (output) obtained by substituting different values of L in the production function Qc = -L3 + 30L2 +20L. Marginal product refers to the product obtained by increasing one unit of input. In present case, the change in total quantity of product by including one more worker is termed as marginal product of labor.
ADVERTISEMENTS:
Marginal product of labour can be calculated with the help of the following formula:
MPL = ∆Q/∆L
Where, ∆Q = Change in output
∆T = Change in labor
ADVERTISEMENTS:
∆Q = new product – old product
∆L = new labor – old labor
For example, in Table-3, when L=2, then marginal product is as follows:
∆Q = TPL – TPL-1
∆Q = 152-49
∆Q = 103
ADVERTISEMENTS:
∆L = 2-1
∆L = 1
Marginal product when L=2,
MPL = ∆Q/∆L
MPL = 103/1
MPL = 103
ADVERTISEMENTS:
In present case, the value of L is one in every case. Therefore, we can only use ∆Q to calculate the marginal product.
There is one more column of average product in Table-3. Average product refers to the ratio of total product to the variable input used to get the total product.
The formula used to calculate average product is as follows:
APL = TPL/ Number of Workers
For example, in Table-3, when L =3, then average product is as follows:
TPL = 303
ADVERTISEMENTS:
Number of Workers = 3
Average product when L = 3,
APL = TPL/Number of Workers
APL = 303/3
APL =101
In Table-3, last column shows the three stages of production, which are explained as follows:
ADVERTISEMENTS:
i. Stage I:
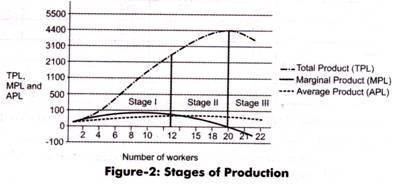
Refers to the stages of production in which the total output increases initially with the increase in number of labor table-3 shows the increase in marginal product till the number of workers increased to 10 and 11. The marginal output produced by tenth and eleventh worker is same, which implies that they yield constant returns.
ii. Stage II:
Refers to the stage in which total output increases but marginal product starts declining with the increase in number of workers. 1 able-3 shows the declining of marginal product as the number of workers reaches 12.
iii. Stage III:
Refers to the stages in which the total product starts declining with an increase in number of workers. As shown in Table-3, the total output reaches to maximum level at the twentieth worker. After that, the total output starts declining.
Figure-2 shows the graphical representation of the three stages of production:
There are two types of laws that work in the three stages of production. One is law of increasing returns in stage I and law of diminishing returns in stage II. There are several factors that are responsible for the application of these laws. Among these factors, one of the most important factors for the law of increasing returns is fixed capital. Less number of labor lead to unutilized capital, because capital is indivisible.
For example, if the capital-labour ratio is 2:6 and capital is indivisible and labor hired is less than six, then capital is unutilized. Another important factor responsible for the increase of labor productivity is division of labor. This can be achieved by hiring more workers to reach the maximum output or optimum capital-labor ratio.
Beyond the optimum capital-labor ratio, there would be no effect of an increased labor on the productivity of labor because labor can substitute capital to a limited extent. This leads to an increase in the number of workers to compensate the decrease in capital and capital-labor ratio.
Significance of Law of Diminishing Returns:
The law of diminishing returns can be applied in a number of practical situations. The law has implication in most of the productive activities, but cannot be applied in all productive activities. Therefore, it cannot be applied universally. The application of this law has been seen more in agricultural production rather than industrial production.
This is because the inputs in agriculture production are natural, while in industrial production, inputs are generally manmade. Therefore, if increasing variable input is applied to fixed inputs, then the marginal returns start declining.
Law of diminishing returns helps mangers to determine the optimum labor required to produce maximum output. In addition, with the help of graph of law of diminishing returns, it becomes easy to analyze capital-labor ratio. If an organization falls in stage I of production, it implies that its capital is underutilized.
Therefore, the organization needs to increase the number of workers. In case, the organization is in stage III; it implies that the organization needs to reduce number of workers. However, stage I and stage III are irrelevant for managers for setting the targets of output.
Only stage II is used for this purpose because this stage provides information about the number of workers that need to be employed for reaching the maximum level of production. The decision regarding the employment of workers and setting the maximum level of output would only be possible when wage rate is known.
Optimal Employment of Labor:
As shown in Table-3, when the number of workers is 20, then the output reaches to its maximum level. In such a case, an organization would prefer to hire 20 workers to meet the optimum level of output in case if the labor is available at free of cost, which is not possible. Hiring workers always incurs a cost for an organization in terms of payment of wages in exchange of services rendered by workers.
Therefore, the number of workers employed depends on optimum output, product price, and wage rate. The maximum profit can be attained if marginal cost is equal to marginal revenue. In the present case, marginal cost would be equal to marginal wages that is MC=MW. In case of factor employment, the concept of Marginal Revenue Productivity (MRP) is used. MRP refers to the value of product obtained by multiplying the price of product and marginal product of labor.
The following formula is used to calculate MRP:
MRP = MPL * P
Let us understand MRP with the help of an example. Suppose the price of coal is Rs. 10. If Table-3 is considered, MPL for the fifth worker is 229.
In such case, MRP for the fifth worker can be calculated as follows:
MRP = MPL * P
MRP = 229 * 10
MRP=RS. 2290
Similarly, MRP can also be obtained for different workers. By considering Table-3, suppose the wage rate (equal to MRP) fixed by an organization is Rs.2900. In such a case, the organization would hire 7 workers because if it hires the 8th worker, then MRP would be Rs. 3010 (301*10). This would lead to a loss of Rs. 110 for the organization.
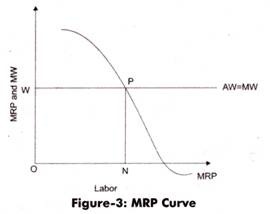
The MRP of different workers can be listed in a table and a graph can be formed from that table. By joining the MRP of different workers on the graph, a curve is obtained known as MRP curve.
Figure-3 shows the MRP curve:
This curve can be compared with MW curve. For example, in present case, wage rate is equal to OW. When wage rate becomes constant, then average wage is equal to marginal wage (AW = MW). The graph shows a horizontal straight line in case the wage rate become constant. The point at which MRP curve and straight line of AW= MW intersects is regarded as the optimal number of employees required to produce maximum profit.


