The extent to which a factor is combined to the other factor depends on the prices of factor and the willingness of organization to spend money on factors.
Iso-cost line represents the price of factors along with the amount of money an organization is willing to spend on factors.
In other words, it shows different combinations of factors that can be purchased at a certain amount of money.
For example, a producer wants to spend Rs. 300 on the factors of production, namely X and Y. The price of X in the market is Rs. 3 per unit and price of Y is Rs. 5 per unit.
ADVERTISEMENTS:
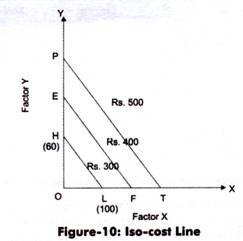
In such a case, the iso-cost line is shown in Figure-10:
As shown in Figure-10, if the producer spends the whole amount of money to purchase X, then he/she can purchase 100 units of X, which is represented by OL. On the other hand, if the producer purchases Y with the whole amount, then he/she would be able to get 60 units, which is represented by OH.
If points H and L are joined on X and Y axes respectively, a straight line is obtained, which is called iso-cost line. All the combinations of X and Y that lie on this line, would have the same amount of cost that is Rs. 300. Similarly, other iso-cost lines can be plotted by taking cost more than Rs. 300, in case the producer is willing to spend more amount of money on production factors.
ADVERTISEMENTS:
With the help of isoquant and iso-cost lines, a producer can determine the point at which inputs yield maximum profit by incurring minimum cost. Such a point is termed as producer’s equilibrium.
