
Isoquants in the Fixed Input-Proportion Case:
In the standard isoquant (IQ) analysis, the proportion between the inputs (say, X and Y) is a continuous variable; inputs are substitutable, although they are not perfect substitutes, MRTSX,Y diminishing as the firm uses more of X and less of Y.
Here we shall assume, however, that the inputs (X and Y) used by the firm can by no means be substituted for one another—they have to be used always in a fixed ratio. The production function of the firm in this case is called the fixed coefficient production function.
To illustrate the case, let us suppose that the two inputs (X and Y) are always to be used in the ratio 1 : 1 to produce the firm’s output. That is, any particular quantity of X can be used with the same quantity of Y. Let us suppose, 10 units of X when used with 10 units of Y would produce an output of 100 units.
Since inputs are to be used in a fixed ratio, (here 1 : 1), if the quantity of Y is increased, keeping the quantity of X constant at 10, output would remain the same at 100 units. Similarly, if the quantity of X is increased, keeping the quantity of Y constant at 10 units, output would remain the same at 100 units.
ADVERTISEMENTS:
That is, the input combinations (10, 15), (10, 20), (10, 25), etc. would all produce the same output, 100 units, as produced by the combination A (10, 10). Similarly, the combinations (15, 10), (20, 10), (25, 10), etc. will produce the same output, 100 units, as produced at the point A (10, 10).
Now if we join all these combinations that produce the output of 100 units, we shall obtain a L-shaped isoquant for q = 100 units, with its corner at the combination A (10, 10). This IQ has been shown in Fig. 8.19. Just in the same way, we may have L-shaped IQs in this 1 : 1 ratio case, with corners at the combination B (15, 15), C (20, 20), etc.
All these IQs together give us the IQ map in the fixed coefficient case. The line through the points A, B, C, etc. would be a straight line from the origin, for at any point on the line the y/x ratio is 1 : 1, and the slope of the line is equal to 1.

The fixed coefficient production function may or may not be subject to constant returns to scale. For example, in Fig. 8.19, as the firms moves from the point A to the point B, both the inputs are increased by the factor 1.5. If output also increases as a result by the same proportion and becomes equal to 150, then fixed efficient production function is with constant returns to scale. This has been the case in Fig. 8.19.
ADVERTISEMENTS:
Again, in Fig. 8.19, as the firm moves from the point B (15, 15) to the point C (20, 20), both x and y rises by the factor 4/3. Here q, as a result, would rise by the factor 4/3 and would become equal to y x 150 = 200, since it has been assumed to be a case of constant returns to scale.
However, if the output increased by more (or less) than 1.5 times in the first instance and then by a larger (or smaller) factor than 4/3, then the fixed coefficient production function would have given us increasing (or decreasing) returns to scale.
Cost-Minimising Equilibrium of the Firm in the Fixed Coefficient Case:
The fixed coefficient IQ map of the firm is given in Fig. 8.19. Since the IQs here are L-shaped, the downward-sloping iso-cost line (ICL) may ‘touch’ an IQ only at its corner point. The input prices being given, we have the parallel ICLs in Fig. 8.19, each corresponding to a particular level of cost.
ADVERTISEMENTS:
Given the output constraint or the IQ, the firm would be in cost-minimising equilibrium at the corner point of the IQ where an ICL touches it. For, at this point, the IQ takes the firm to the lowest possible ICL. It may be noted here that the ICL may (physically) touch an IQ at the latter’s corner point, but it cannot be a tangent to the IQ at this point, because here dy/dx|IQ does not exist.
Now, if the firm wants to produce 100 unity of output, its output constraint is given by IQ1. The firm would be able to produce this output at the minimum possible cost if it uses the input combination A (10, 10). At this point the IQ takes the firm on the lowest possible ICL.
Similarly, if the firm’s output quantity rises to q = 150 units, its cost-minimising equilibrium point would be B (15, 15) and at q = 200, the firm’s equilibrium would be at the point C (20, 20), and so on. Therefore, here, the firm’s expansion path would be the ray from the origin, OE, passing through the points A, B, C, etc.
Since the firm always uses the inputs in the same ratio (here 1:1), its expansion path would be the ray from the origin with slope = 1, and equation of this path would be y = x. In general, if the fixed input ratio be L : K = m: n, then at each point on the expansion path we would have K/L = n/m and so the equation of the path would be K/L = n/m, or, K = (n/m)L, and the slope of the path would be .
The Average and Marginal Product Curves under the Fixed Coefficient Production Function with Constant Returns to Scale:
Let us assume that the firm, to produce its output, has to use two inputs, labour (L) and capital (K), in fixed proportions. If the quantities used of the two inputs be L and K, and if the quantities of labour and capital required per unit of output be ‘a’ and ‘b’, respectively, then the firm would be able to produce an output quantity (Q) which would be the smaller of the two quantities L/a and K/b.
That is why the fixed coefficient production function would be:
![]()
In (8.77), L and K are used in a fixed ratio which is a : b. Also if L and K are doubled, say, then both L/a and K/b would be doubled and the smaller of the two, which is the output quantity, would also be doubled. That is why (8.77) is a fixed coefficient production function with constant returns to scale.
Let us now see how we may obtain the total, average and marginal product of an input, say, labour, when the production function is fixed coefficient with constant returns to scale like (8.77). If we are to do this, we have to assume that the firm uses varying quantities of labour with a fixed quantity, K̅, of the other input, capital.
ADVERTISEMENTS:
If the inputs are used in the fixed ratio a : b, then the quantity of labour, L*, that has to be used with K̅ of capital is
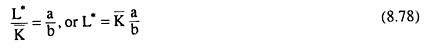
Here, since L*/a = K̅/b, (8.77) gives us that Q* at the (L*, K̅) combination of the inputs would be
Q* = TPL = L*/a = K̅/b (8.79)
ADVERTISEMENTS:
Output quantity (Q*) is the same for L = L* and K = K̅ for L*: K̅ = a/b [from (8.78)]
From (8.79), we have obtained that when L* of labour is used, we have
Q* = TPL =K̅/b (8.80)
We have plotted the values of L* and Q* = TPL in Fig. 8.20(a), where the point R represents
ADVERTISEMENTS:
the combination (L*, Q*). In the case of production function (8.77), as L diminishes from L* and approaches zero, Q =TPL diminishes proportionately and approaches zero along the straight line RO, i.e., the straight line OR is the TPL curve for L ≤ L*.
On the other hand, as L increases from L = L*, K remaining constant at K = K̅, Q remains unchanged at Q*= K̅/b, since production uses inputs in a fixed ratio. That is, for L > L*, the Q = TPL curve would be a horizontal straight line at the level Q* = K̅/b. Therefore, the TPL curve of the firm would have a kink at the point R, as shown in Fig. 8.20(a).
Now, since OR is a ray from the origin, we have, along this ray, Q/L = Q*/L* =∂Q/∂L = constant, or, we have APL = MPL along the ray OR. That is, for L ≤ L*, we have APL ≡ MPL= Q*/L* = K̅/b 1/L* = K̅/b b/aK = 1/a = constant, i.e., for L ≤ L*, APL ≡ MPL curve would be a horizontal straight line at the level of 1/a.
Then, for L > L*, we have, TPL = constant = K̅/b in Fig. 8.20(a), and, therefore, we would have
APL = TPL /L
Or, APL . L = TPL = constant (8.81)
ADVERTISEMENTS:

(8.81) gives US that the area under the APL curve is a constant, i.e., the APL curve is a rectangular hyperbola. In other words, for L ≤ L*, the APL curve would be a horizontal straight line and for L > L*, the APL curve would be a rectangular hyperbola. This curve has been shown in Fig. 8.20(b).
Lastly, we have already seen that for L < L*, the MPL and APL curves would be the same horizontal straight line. But for L > L*, the TPL becomes constant w.r.t. L, and the TPL curve is a horizontal straight line. So now the MPL which is, by definition, the derivative of TPL (= Q) w.r.t. L, becomes zero at L > L*, i.e., the MPL curve would coincide now with the L-axis in Fig. 8.20(b).
Therefore, for L ≤ L*, the MPL curve is a horizontal straight line at a positive level being identical with the APL curve, and for L > L*, the MPL curve would coincide with the horizontal L-axis. Therefore, at L = L*, the MPL curve would have a discontinuity between its two horizontal parts—the discontinuity has been shown by the dots in Fig. 8.20(b).
Finite Number of Processes in Production under Fixed Proportion of Inputs:
While discussing the fixed coefficient production function we have so far assumed that the factors can be combined in one particular ratio to produce an output, and absolutely no substitution is possible between the inputs, i.e., the output can never be produced by using the inputs in any other ratio.
However, a more realistic case would be obtained if we assume that a finite number of processes or input ratios can be used to produce a particular output. A process or an input ratio is represented by a ray from the origin, the slope of the ray being equal to the said input ratio.
ADVERTISEMENTS:
In Fig. 8.21, we have given five different rays representing five different processes or five different input ratios. These ratios are 11 : 1, 8 : 2, 5 : 4, 3 : 7 and 2:10 and the rays representing these ratios are OA, OB, OC, OD and OE.
We have assumed here that the input combinations (1, 11), (2, 8), (4, 5), (7, 3) and (10, 2) in the five processes, all can produce the output quantity of 100 units—all these points are the corner points of the respective L-shaped IQs.
In Fig. 8.21, the points A, B, C, D and E—all can produce the output quantity of 100 and only these five points in the five processes are available for the production of 100 units of output. If we join these points by line segments, we would obtain a kinked IQ path. On this path, only the five points, A, B, C, D and E are directly feasible input combinations that can produce 100 units of output.
It is interesting to note that the kinked line ABCDE in Fig. 8.21 looks very much similar to the ‘normal’ negatively sloped convex-to-the origin continuous IQ. But it is yet very much different, because it is not a continuous curve. No input combination lying on the segment between any two kinks is directly feasible to produce the output quantity of 100 units.
For example, 100 units of output cannot be produced directly by a process using the input combination (2.5, 7.25) that lies on the line segment BC because the input ratio 7.25 : 2.5 is not feasible.
However, if the input quantities are sufficiently divisible, any particular input-ratio like 7.25 : 2.5 can be used to produce 100 units of output, i.e., the firm can produce the output at a point on the segment between any two kinks (here B and C).
ADVERTISEMENTS:
The only thing that the firm would have to do in this case, is to combine the two processes, OB and OC. Here the firm would have to produce 75 units of output by applying the process OB. In this process, it would use 1.50 units of X and 6 units of Y.
And it would have to produce 25 units of output by applying the process OC. In this process, it would use 1 unit of X and 1.25 units of Y. In the end, the firm would be able to produce 100 units of output by using 2.50 units of X and 7.25 units of Y.

Now, if the number of fixed proportions processes were not 5 but many, then there would be many kinks in the kinked IQ path, one kink for each process, and there would be many rays from the origin like OA, OB, etc. As the number of processes increases, the kinked IQ path would look more and more like the continuous IQ of a firm.
We may conclude, therefore, that the ‘normal’ and continuous IQ of a firm emanating from a variable proportions production function is the limiting form of the kinked IQ path of the fixed proportions processes—we shall approach this limiting form as the number of processes increases indefinitely.
That is why, although production in the real world is often characterized by fixed proportions production processes, economists find it quite rational to use the smooth isoquants and variable proportions production function in economic theory. This would greatly simplify the analysis of economic theory without causing much harm to reality.