In this article we will learn how to draw the AR and MR demand curve under perfect competition.
A firm under perfect competition is price-taker. This simply means it can alter its volume of output and sales level without significantly affecting the market price of its product. This explains why a firm operating in a perfectly competitive market has no power to influence that market through its own individual actions. It must passively accept whatever price happens to prevail in the market.
At the prevailing market (ruling) price it can sell as much as it likes. This means that the demand for its product is completely elastic at a particular (market determined) price. As R.G. Lipsey put it, “The demand curve facing each firm in perfect competition is horizontal, because variations in the firm’s output over the range that it needs to consider have no noticeable effect on price”.
Lipsey has also clarified an important point accepted by economists for a long time. As he put it, “The horizontal (perfectly elastic) demand curve does not mean that the firm could actually sell an infinite amount at the given price. It means, rather, that the variations in production that will normally be possible for the firm to make will leave price virtually unchanged because their effect on total industry output will be negligible.”
ADVERTISEMENTS:
The Revenue Concepts:
To study the nature of a firm’s demand curve as also the revenues that firms receive from the sales of their products, economists define 3 concepts, viz., TR, AR and MR. TR is the total amount received by the firm from the sale of a product. If q units are sold at price of p rupees, TR = pq. AR is the amount of revenue per unit sold.
Since this is equal to the price at which the product is sold (AR = TR/q = pq/q = p) it is called the seller’s demand curve or the demand curve for the product of the an individual seller. MR is the change in a seller’s TR resulting from a change in its sales level by one unit. In economics, the word ‘margin’ always refers to anything extra. This means at the existing level of sales, MR shows what revenue the firm could gain by selling one unit more and what revenue it would lose by selling one unit less.
Industry Demand and Firm Demand:
ADVERTISEMENTS:
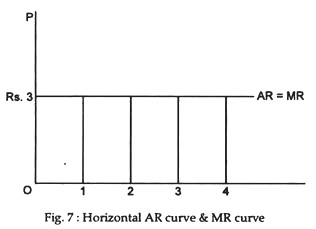
Fig. 7 shows both the demand curve for the product of a single firm under perfect competition.
The industry demand curve slopes downward from left to right, but the firm’s demand curve horizontal because the firm’s output variation (measured in thousands of tonnes) has hardly as percentage effect so an industry output (measured in millions of tonnes). At the prevailing market price (Rs. 3), industry output is 200 million tonne. At this price, the firm considers producing a maximum output of 60,000 tonne.
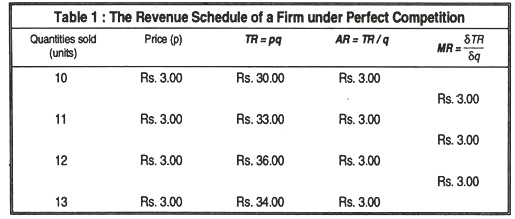
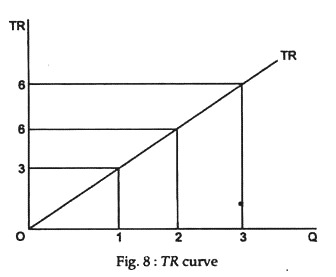
To illustrate these three revenue concepts, let us consider a firm which is selling an agricultural product in a perfectly competitive market (such as wheat) at a price of Rs. 3 per tonne. Since price remains fixed, TR rises by Rs. 3 for every tonne sold. Since every unit brings in Rs. 3, the AR per unit sold is surely Rs. 3. Moreover; since each additional unit sold brings in Rs. 3, the MR of an extra unit sold is also Rs. 3. Table 1 shows revenue figures for certain range of output (between 10 and 13 units). Fig. 8 illustrates the corresponding total revenue (TR) curve.
ADVERTISEMENTS:
The most important point to note here is that, as long as the volume of the firm’s output does not significantly affect the price at which that output sells, MR = AR (which is always equal to p which is Rs. 3). We see that AR and MR are the same horizontal line (drawn at the level of market price) and parallel to the x-axis.
As Lipsey has put it, “Because Q the firm can sell any Fig. 8: TR curve quantity it chooses at this price, the horizontal line is also the firm’s demand curve-, it shows that any quantity the firm chooses to sell will be associated with the same market price”.
In short- “if the market price is unaffected by variations in the firm’s output, then the firm’s demand curve, its AR curve and MR curve will coincide in the same horizontal line”.
This means that for a firm in perfect competition, p = MR. For such firm TR increases in direct proportion to output.


