Determination of Price Under Perfect Competition!
Earlier economists took one sided view of the problem of price determination. It was only Dr. Marshall who gave equal importance to demand and supply.
He pointed out that it was useless to argue whether it was demand curve or it was supply curve which was more important.
He pointed out that a market is composed of two parties, viz. the buyers and the sellers and both of them are equally important. In the absence of anyone, price cannot be determined. He, therefore, argued that both buyers and sellers are important in the market and, both demand and supply curves are important for determining the price of a commodity.
ADVERTISEMENTS:
Marshall compared the demand curve and the supply curve to the two blades of a ‘pair of scissors’. He pointed out that blades are needed to cut cloth. If a person wants to cut with a single blade it will be impossible.
He further stated that at different occasions the upper or the lower blade becomes more or less important. According to him, it is a matter of time that at some moments it is the demand curve and at some other moments it is the supply curve, which is more important.
In the same way, Prof. Stonier and Hague has correctly remarked, “The only really accurate answer to the question whether it is supply or demand which determines price is that it is both.” The price which will come to prevail in the market is one at which quantity demanded is equal to quantity supplied. The price at which quantity demanded equals quantity supplied is called equilibrium price.
Factors Affecting Price Determination:
Let us discuss these two factors:
(i) Total Demand:
ADVERTISEMENTS:
Demand does not mean the amount of a commodity, say, tea, which people need, or would like to have, but the effective demand, the amount which people are willing to buy at various prices. Every unit of a commodity has a demand price, the price at which that unit finds a buyer.
Other things being equal, a fall in price leads to an increase in quantity demanded and rise in price leads to reduction in quantity demanded. A fall in the price induces the existing buyers to buy more and attracts new customers. It may also have substitution and income effects. The quantity demanded thus varies with every change in price.
(ii) Total Supply:
Supply means the quantity offered for sale by producers. Thus the supply of tea does not mean the actual stock of tea; it means the amount of tea which the producers are willing to put on the market at various prices.
Every unit of a commodity has a supply price-the price at which it is offered for sale. Other things being equal, a rise in price leads to an increase in the quantity offered for sale, and a fall in price reduces the quantity offered for sale.
Equilibrium between Demand & Supply Prices:
Equilibrium between demand & supply price is obtained by the interaction of these two forces.
ADVERTISEMENTS:
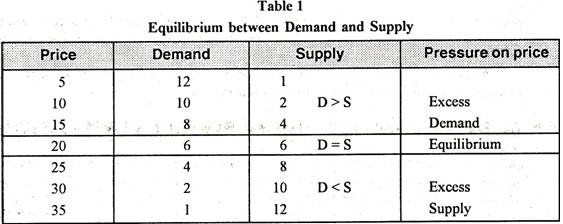
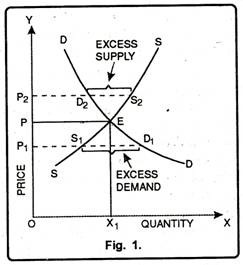
It is being discussed with the help of a table 1 and a diagram 1 below:
In the table 1, at price Rs. 20 the quantity demanded and quantity supplied are equal to each other. Thus, the price Rs. 20 will be settled down in the market where both the buyers and sellers are satisfied. Once this equilibrium price prevails in the market, there will be no tendency for it to change.
Now, suppose the price is Rs. 25 in the market, the buyers would demand only four units while the sellers are ready to supply 8 units. For this the sellers will compete with each other to sell more units of the commodity.
This process will continue, till the equilibrium price is reached. On the other hand, if the price falls below the equilibrium level say Rs. 15 the buyers will demand 8 units and the sellers will be ready to supply 4 units.
Diagrammatic Representation:
In figure 1, DD is the demand curve, SS is the supply curve. Demand and supply are in equilibrium at point E where both curves intersect each other.
Here, equilibrium output is OX1 and price is OP. Now, suppose the price is greater than equilibrium price i.e. OP2. At this price quantity demanded is P2D2, while the quantity supplied is P2S2. Thus, D2S2 is the excess supply which the buyers will not take off the market at price OP2.
In order to dispose of the said excess supply, the seller will compete with each other and will bring down the price.
ADVERTISEMENTS:
Hence, the price will fall to the level of OP. At price OP1 the buyers will demand P1D1 while the sellers are prepared to supply P1 S1. In this way, unsatisfied buyers will compete with each other to have the limited supply. Therefore, there will be tendency for the price to rise to the level of OP.
Equilibrium Price of Firm and Industry:
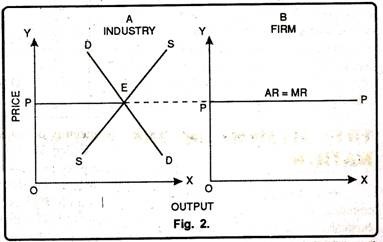
Prices under perfect competition are determined by industry and each firm will have to follow this price. It can be shown with the help of fig. 2.
In Fig. 2A demand curve DD cuts the industry supply curve SS at point E. Thus, E is the equilibrium point which determines OP as an equilibrium price. Fig. 2B reflects the firms demand curve. The firm will have to sell all its output at OP price.
ADVERTISEMENTS:
The firm cannot increase or decrease their price as it is determined by industry. It is so because under perfect competition firm is a price taker and not a price maker.
Changes in Equilibrium:
The equilibrium price and quantity will change as a result of shift either in demand curve or supply curve or both.
It can be shown as follows:
(i) Effect of Shift in Demand:
ADVERTISEMENTS:
Demand changes whenever there is a change in the conditions of demand- income, tastes, prices of substitutes and complements etc. If demand increases due to a change in any one of these conditions the demand curve moves upward to the right. If, on the other hand, demand decreases, the demand curve moves downward to the left. Let us consider the effects of changes in demand on price increases (i.e., at the old price a greater quantity is demanded) price and quantity demanded both increase.
Let us show the effect of a change in demand on price and quantity. Given the supply curve, an upward shift in the demand curve causes the price to rise. A downward shift of the demand curve causes the price to fall.
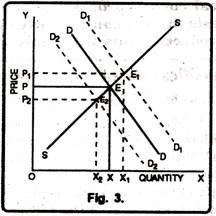
This is shown in the figure given below:
In figure 3 Quantity demanded and supplied is shown on X-axis whereas price on Y-axis. DD is the original demand curve. Initially, the demand and supply curves intersect each other at point E. Thus, OP is the equilibrium price and OX is the equilibrium quantity demanded.
Now, suppose the demand increases and takes the form of D1 D1. The new demand curve intersects the supply curve at point E1, where the quantity demanded goes to OX1 and price at OP1. In the same way, if the demand curve shifts downward and assumes the form D2D2, the equilibrium will be at point E2 and, therefore, quantity demanded will be OX2 and price is OP2. Thus, we conclude that if the supply conditions are given then there is direct relation between demand and price.
(ii) Effect of Shift in Supply:
ADVERTISEMENTS:
We shall consider the effects of changes in supply on price assuming that demand remains unchanged. An increase in supply is represented by a shift of the supply curve to the right (or downward) and a decrease in supply is represented by a shift to the left or upward. The general rule is: if the supply increases, price falls and if supply decreases price rises.
In figure 4 both the demand and supply curves intersect each other at point E. Thus, OP is the equilibrium price and OX is the equilibrium quantity. Now, supply curve shifts from SS to S1S1– At this level quantity demanded increases form OX to OX1 but the price falls from OP to OP1. Similarly, if the supply curve takes the form of S2S2 instead of SS, that way quantity demanded falls to OX2 while die price increases from OP to OP2– Here; we may observe that there is inverse correlation between quantity demanded and price.


