Learn about the comparison among price, output and profits under Monopoly and Perfect Competition.
1. Excess Capacity:
In a perfectly competitive market in the long-run, Price = (AR = MR) = LMC =LAC at its minimum. This means that competitive firms in the industry in the long- run are earning normal profits. They are of the optimum size and are producing to their full capacity. But under monopoly, the long-run equilibrium price is higher than the point of intersection of the LMC and MR curves i.e. P > LMC = MR.
Further, the minimum point of the LAC curve is to the right of the equilibrium point of the curve LMC = MR. This shows that the monopoly firm is of less than the optimum size, does not produce to its full capacity and earns abnormal profits.
Both the situations are illustrated in Figure 38.16 (A) and (B). Since the monopoly firm has excess capacity, there is under-allocation of resources to the monopoly firm and misallocation of resources in the economy.
2. Loss in Consumer’s Welfare:
ADVERTISEMENTS:
But in order to make these comparisons definite, we assume that the cost curves and the revenue curves are the same for both the monopoly firm and a perfectly competitive industry. Take Figure 17 where D/AR is the demand curve of the perfectly competitive industry and MC is its supply curve. Both intersect at point P and OQ1 output is sold at Q1P price. The equilibrium of the monopoly firm takes place at point E where its MC curve cuts its MR curve from below.
The monopolist produces and sells OQ output at OM price. The figure shows that the monopoly price QM is higher than the competitive price Q1P and the monopoly output OQ is less than the competitive output OQ1. Thus the consumers are worse off under monopoly because they are made to pay a higher price and get a smaller output than under perfect competition where they get more commodity at a lower price. This is a loss in consumer is welfare.
3. Under-Utilisation of Factor Input:
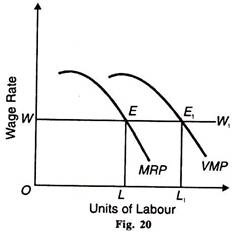
It can also be shown that the existence of monopoly leads to a less utilisation of a factor input than under perfect competition. In a perfectly competitive factor market, the price of a factor input, say labour, is given. The demand curve for labour for the firm in a perfectly competitive market is the VMP curve.
For the monopolist, the demand curve for labour is its MRP curve. Thus for both the perfect competitor and the monopolist, their respective demand curves slope downward due to diminishing physical marginal returns.
ADVERTISEMENTS:
Moreover, the MRP curve of the monopolist lies below the VMP curve under perfect competition because the MR curve is always below the price for the monopolist: e.g., P (AR)>MR. Figure 20 explains the under-utilisation of a factor input labour under monopoly, given the wage rate. The monopoly firm is in equilibrium at point E where the MRP curve equals the wage rate WW1 the price of labour service.
The firm employs OL workers. But a perfectly competitive firm employs OL1 workers when its demand curve VMP equals the wage rate at point E1 .Thus the monopoly firm employs LL1 less units of labour. It implies that given the assumption of diminishing physical marginal returns, there is under-utilization of productive resources under monopoly.
4. Dead Weight Loss:
Further, monopoly reduces Consumer’s surplus. This is because output under monopoly is smaller and the price is higher than under perfect competition. The reduction in the welfare of the consumer can be shown as the loss in consumer’s surplus in terms of Figure 18.
ADVERTISEMENTS:
Suppose the consumer is willing to pay OB price for OQ1 quantity of the product. But under perfect competition, he is able to get larger quantity OQ of the product at a lower price ОA. Thus he gets consumer’s surplus equal to the area BP1PA. Now suppose monopoly is established for the production of this product.
As a result, the monopolist fixes the higher price OB, sells less quantity OQ1 and takes away BP1EA as his profits. As the consumers’ can buy only OQ quantity of the product at the higher price OB (=Q1P1) and OQ1 quantity of the product is not available to him. Thus the triangle, P1PE is the net loss in his welfare: BP1PA-BP1EA = P1PE. This is the net loss in consumer’s surplus or dead weight loss of the society. We may conclude that monopoly leads to misallocation and under-utilisation of resources and reduction in consumer’s welfare.
