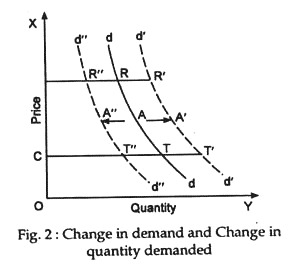
This article will help you to learn about the difference between change in demand and change in quantity demanded.
Difference between Change in Demand and Change in Quantity Demanded
When there is a change in the price of a commodity, all other things remaining the same, there is movement along the same demand curve from one position to another. If price falls there is movement from left to right which means that a larger quantity is demanded at a lower price. This is known as extension of demand. By contrast, if price falls there is a movement from right to left along the same demand curve which means that a smaller quantity is purchased at a higher price.
This is known as con traction of demand. The demand curve shows the relationship between the price of a commodity and the quantity demanded of the same on the assumption that all other variables affecting demand remain constant. However, the term quantity demanded is used in a narrow sense. It refers to a particular point on the curve.
Now by looking at a demand curve we can see the effect of change in price on quantity demanded. If price rises the quantity demanded of a commodity falls and if price falls the quantity demanded of the same rises. The effects of such price changes are shown by movements along the same demand curve from left to right or right to left. Such movements show changes in the quantity demanded of a commodity.
ADVERTISEMENTS:
These movements are sometimes described as extensions or contractions of demand. If price falls there is a downward movement to the right. This is known as an extension of demand. On the other hand, a contraction of demand refers to an upward movement along the same demand curve from the right to the left in response to a rise in price.
If, on the other hand, there is a change in any other factor (except the price of the commodity under consideration) the demand curve will shift to a new position. This implies that, at a given price a larger or a smaller quantity of the commodity will be demanded. This is known as a change in demand.
Such a change occurs when there is a change in the income of buyers or in its distribution, or in the prices of related goods (substitutes and complements), in people’s expectations or in non-economic factors. A change in demand is usually referred to as a change in the conditions of demand. For example, when most people in India get bonus at the time of festival they buy more sweets even though their prices remain the same.
Changes in demand are of two types. If demand increases the demand curve shifts to the right. If demand falls the demand curve shifts to the left. Such changes show the different quantities are demanded at every price. In such cases, we have to draw a new demand curve as is shown in Fig. 2. It shows two demand curves for a commodity. A shift of the demand curve from D1D1 to D2D2 implies an increase in demand; more is demanded (q1 instead of q0) at the same price (p0).
A shift in the opposite direction would imply a decrease in demand. Thus, less is (q0 instead of q1) demanded at a fixed price (p0). A change in quantity demanded for the commodity resulting from a change in its own price will lead to a movement along the curve itself; this indicates either a contraction or an extension of demand.
For example, when the demand curve is D2D2, a fall in price from p1 to p0 increases the quantity demanded from q0 to q1. On the other hand, when the demand curve is D2D2, a rise in price (from P0 to P1) causes a movement upward along the same demand curve. Similarly, the quantity demanded falls from to q2 when price rises from P0 to P1.
The difference between the two things is clearly indicated in the following:
The above table contains three demand schedules. The change in demand can be illustrated by taking the Schedule No. II as the original schedule, which shows that the quantity demanded is 10,000 units at Rs. 50 per unit, 15,000 units at Rs. 40 and 20,000 units at Rs. 30. The fall in demand at the same price is shown in the Schedule No. I and the rise in demand in the Schedule No. III. So, here the ‘change in demand’ at the same price causes a change in the schedules.
ADVERTISEMENTS:
The change in the quantity demanded can be illustrated in any one of these schedules. Let us take the Schedule No. II. It shows that at a price of Rs 50 per unit the amount demanded is 10,000 units. When the price falls to Rs 40 the amount demanded increases to 15,000 units; and when the price falls further to Rs. 30 the amount demanded increases further to 20 000 units So the change in the quantity demanded does not cause any change in the schedule; it involves a movement along a particular schedule.

