
This article will help you to learn about the difference between ARC elasticity and point elasticity.
Difference between ARC Elasticity and Point Elasticity
Difference # ARC Elasticity:
There are two measures of price elasticity of demand – arc elasticity and point elasticity. Arc elasticity concept is easy to grasp. Here, the elasticity is measured over an arc of the demand curve. Suppose the demand curve for a commodity is as shown in Fig. 7. Let us assume at a price Po demand is Q0. Price then changes to P1, when demand also changes to Q1.

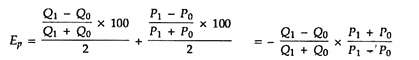
Here, easily we can define ∆Q = Q1 – Q0 and ∆P = P1 – P0. But what about Q and P since each of P and Q has two values (initial value and the changed value)? The readymade solution is to use some average of both the values, i.e., we should take Q = Q0 + Q1/2 and P = P0 + P1/2.
ADVERTISEMENTS:
Thus, we could get:
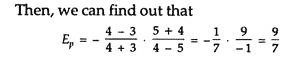
Suppose, initially at price of Rs. 5 per kg. (i.e., P0 = 5) demand was 3 kg. (i.e., Q0 = 3) and after the price has changed to Rs. 4 per kg. (i.e., P1 = 4), demand changes to 4 kg. (i.e., Q1 = 4).
The arc elasticity concept is useful since in reality price and quantity changes occur in jumps, i.e., there are gaps between any two values of both price and quantity demanded. This concept yields only rough or approximate measures, since we here approximate the curvilinear stretch (as the stretch from A to B in Fig. 7) between the two points on the demand curve by a straight line.
ADVERTISEMENTS:
As R.G. Lipsey has put it, “The best approximation to the correct measure, when elasticity is measured between two separate points on a demand curve, is obtained by defining P and Q as the average of the prices and quantities at the two points on the curve.”
Difference # Point Elasticity:
In contrast to the concept of arc elasticity, point elasticity refers to measuring elasticity of demand at a particular point on the demand curve. Actually, it is the limiting case of arc elasticity; since when changes in price (and consequently changes in quantity demanded) are too small, the arc converges to a point.
And, then the effective expression of elasticity measure becomes:
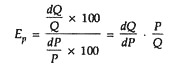
where dP and dQ are infinitesimally small changes in price and quantity demanded (i.e., they are limiting values of ∆P and ∆Q when ∆P → 0 and ∆Q → 0).
Note, here we used only P and Q instead of the average of the two prices and quantities, since P0 + P1/2 and Q0 + Q1/2 reduce to P and Q approximately.
To explain the point-elasticity concept let us first take up the case of straight line demand curve. Suppose, the demand curve is AB as shown in Fig. 8 and we want to measure elasticity at point D. Let the price changes to a very small extent from point D to point E on the demand curve. Thus, Ep = EQ/DQ x DP/OP [Since, dQ = EQ and dQ = DQ assuming EQ and DQ to be very small]. Now, triangles DEQ and DPB are similar.

Hence, the ratio of their sides will be equal. That is,
EQ/DQ = BP/DP
Thus,
Ep = EQ/DQ x DP/OP = BP/DP x DP/OP = BP/OP
i.e., the point elasticity of demand measure reduces to ratio of the base of the smaller triangle BPD and that of the larger triangle ABO. Again, since these triangles, we can have
ADVERTISEMENTS:
Ep = BP/OP = BD/AD
For determining point elasticity in the case of a curved demand curve (rectangular hyperbola) a tangent is drawn to the demand curve at the point of the price; and the lower part of the tangent divided by the upper part gives us the magnitude of elasticity at the said point, as in the Fig. 9. In the above figure, DD is a non-linear demand curve. To measure elasticity at P on it, the tangent MN is drawn. Here EP = PN/MP.
