Let us learn about the change in demand and change in quantity demanded.
Economists often draw a distinction between change in quantity demanded of a commodity and change in its demand. In this context, we may note that the word ‘demand’ is a broad term. It refers to the whole demand curve of a commodity.
The demand curve shows the relationship between the price of a commodity and the quantity demanded of the same on the assumption that all other variables affecting demand remain constant. However, the term quantity demanded is a narrow term.
It refers to a particular point on the curve. Now by looking at a demand curve we can see the effect of a change in price on quantity demanded. If price rises the quantity demanded of a commodity falls, and if price falls the quantity demanded of the same rises.
ADVERTISEMENTS:
The effects of such price changes are shown by movements along the same demand curve from left to right, or from right to left. Such movements show change in the quantity demanded for a commodity. These movements are sometimes described as extensions or contractions of demand.
If price falls there is a downward movement to the right. This is known as an extension of demand. On the other hand, a contraction of demand refers to an upward movement along the same demand curve from right to left in response to a rise in price.
If, on the other hand, there is a change in any other factor—except the own price of the commodity under consideration—the demand curve will shift to a new position. This implies that at a given price, a larger or a smaller quantity of the commodity will be demanded.
This is called change in demand. Such a change occurs when there is a change in income of buyers or in its distribution, or in the prices of related goods (substitutes and complements), or in people’s expectations or in other non-economic factors.
ADVERTISEMENTS:
A change in demand is usually referred to as change in the conditions of demand. For example, when most people in India get bonus at the time of festival they buy more sweets even though prices of sweets remain the same.
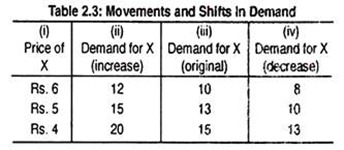
These two concepts can be explained with the help of Table 2.3:
Comparing column (iii) with columns (ii) and (iv) one can explain change in demand. When price of X, say, is Rs. 6 per unit then its initial demand is 10 units. Assuming price at Rs. 6, demand may increase to 12 units or decrease to 8 units. This then is a situation of change in demand.
ADVERTISEMENTS:
Thus, in the above table, column-wise movement refers to a change in demand.
On the other hand, at a price of Rs. 6, initial demand is 10 units. If price falls to Rs. 5 then demand will increase to 15 units, and so on. Such a movement is called a change in quantity demanded. It refers to the movement up and down along a given demand schedule. In other words, row-wise movement refers to a change in quantity demanded.
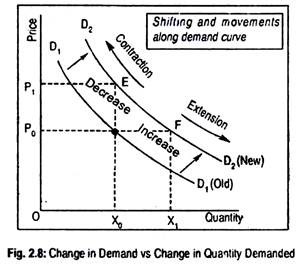
Changes in demand are of two types. If demand increases the demand curve shifts to the right. If demand falls the demand curve shifts to the left. Such changes show that different quantities are demanded at every price. In such cases we have to draw a new demand curve as is shown in Fig. 2.8.
It shows two demand curves for a commodity. A shift of the demand curve from D1D1 to D2D2 implies an increase in demand; more is demanded (OX1 instead of OX0) at the same price (OP0). A shift in the opposite direction would imply a decrease in demand. Thus, less is demanded (OX0 instead of OX1) at a fixed price (OP0).
We know that demand curve shifts its position when all the determinants of demand—except the own price of the commodity— change. An increase in money income, for example, shifts the demand curve the from D1D1 to D2D2.
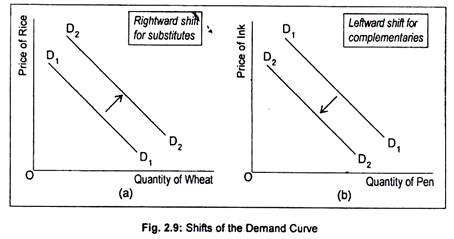
The demand curve also shifts up from D1D1 to D2D2 in Fig. 2.9(a). This is because wheat and rice are substitute goods. As price of rice declines, demand for wheat declines, and vice versa. Because of the increase in the price of rice, demand for wheat rises and the demand curve shifts up from D1D1 to D2D2.
But, in the case of complementary goods, like pen and ink, demand curve shifts backwards. As price of ink declines, demand for pen rises, or, as price of ink rises, demand for pen falls. That is why demand curve moves from D1D1 to D2D2 in Fig 2.9(b).
A change in quantity demanded for a commodity resulting from a change in its own price will lead to a movement along the curve itself; this indicates either a contraction or an extension of demand.
ADVERTISEMENTS:
For example, when the demand curve is D2D2 (Fig. 2.8), a fall in price from OP1 to OP0 increases the quantity demanded from OX0 to OX1. On the other hand, when the demand curve is D2D2, a rise in price (from OP0 to OP1) causes a movement upward along the same demand curve. As a result, the quantity demanded falls from OX1 to OX0.
This distinction can be summarized in the form of a table:
ADVERTISEMENTS:


