In this article we will discuss about the Transportation Costs required in Firm Production.
Transportation Costs by Weber’s Theory:
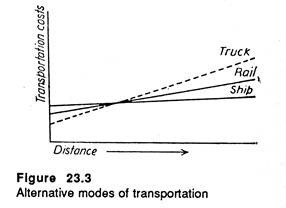
Transportation cost vary from one type of conveyance to the next as well as for different distances. These differences increase or decrease the costs of carrying the same bulk as part of a firm’s production and distribution activities as shown in Fig. 23.3.
According to Alfred Weber, when the necessary transportation is cheap, the tendency for weight-losing products to be produced near the sites of their inputs, and weight-gaining ones, near their customers, may not always hold true.
ADVERTISEMENTS:
This would be the case, for example, if heavier and bulkier inputs could be transported to plants for less cost than the cost at which lighter and less bulky products could be transported to their customers. Because of huge ocean-going ore-carriers for example, new plants using such raw materials as aluminum, coal, and iron ore are now being built at seaports thousands of miles away from the mines that provide their inputs.
The existence of multiple inputs and product markets complicates the picture. The location at each market or input site may save some transportation costs and cause others. Conceptually, each site pulls production towards it in proportion to the transportation costs that its choice would save.
Therefore, the best site from the point of view of minimum transportation costs may be an inter-mediate position rather than at an input or market site. Thus plants are often located in the unlikeliest places, far from inputs or markets in which their products are sold.
ADVERTISEMENTS:
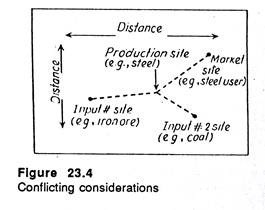
Figure 23.4 shows how the complicating forces resulting from multiple inputs and markets are reconciled. The example is for a firm whose product is produced with inputs from two sites, and sold in only one market.
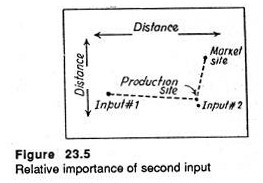
By contrast, Figure 23.5 suggests the location if the second input particularly loses its weight or would, for some other reason, have particularly high transportation costs relative to those of the other input, or to the movement of the finished products to the market. In such a case, the firm’s location is pulled heavily towards the site of the second input.
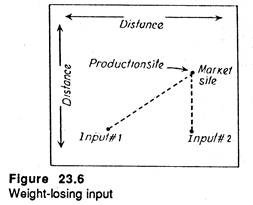
Figure 23.6 depicts the kind of locational effect that would occur if moving a final product to a firm’s customers is relatively expensive; that is, the product gains weight, or its movement to its buyers requires a relatively expensive mode of transportation.
ADVERTISEMENTS:
In this example, the transportation costs of the final product are so great relative to the cost of moving the inputs that the location of production is pulled all the way to the site of the firm’s customers.
Transportation Costs and Differences in Non-Transportation Costs:
It would be a relatively simple matter for firms to decide where to locate if transportation costs were the only costs whose amounts are related to location. But this is not the case.
Labour wages and other costs are often higher in some locations than others. A firm may have to choose between locations having relatively inexpensive inputs but high transportation costs and those having relatively expensive inputs but lower transportation costs.
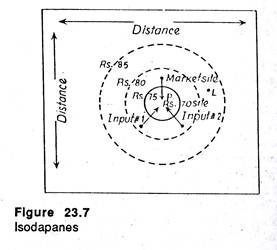
Figure 23.7 shows how transportation costs are related to a firm’s location. Point P shows the location at which an average firm could produce with minimum transportation costs per unit of output. In that location the firm’s transportation costs are Rs. 75 per unit. If the firm leaves that site, perhaps to obtain lower labour costs, the farther it moves away from point P, the more its transportation costs rise.
The Rs. 75 ring around Site P represents the farthest distance the firm could move its production line in each direction, if it would pay Rs. 5 of additional transportation costs per unit of output. And the Rs. 80 ring represents the farthest distance from the minimum transportation cost site where the firm could produce, if it was willing to cover Rs. 10 of additional transportation costs for each of its units of production.
ADVERTISEMENTS:
Such transportation costs rings are called isodapanes. Isodapanes are a useful concept because they can be used to measure the gain in lower non- transportation cost — say, of lower labour or raw material costs — available at alternative sites, against the increased transportation costs that would be associated with them.
Using Figure 23.7 again, consider the possibility that the cost of the labour needed to produce each product would be Rs. 10 less if the firm locates at Site L than if it chooses Site P.
Yet the isodapanes indicate that transportation costs for Site L will increase more than Rs. 10; Site L is between the Rs. 80 isodapane representing Rs. 20 of additional transportation costs, and the Rs. 85 isodapane representing Rs. 15 of additional transportation costs.
Therefore, the gain from using Site L with its cheaper labour will be more than offset by the firm’s increased transportation costs. In this case, the firm would not gain enough from the cheaper labour to justify a move to the alternate site.
ADVERTISEMENTS:
Regional Economies and Diseconomies:
J.D. Lindauer noted that the tendency for firms to locate where their transportation costs are lowest may well be either reinforced or negated by the external economies and diseconomies associated with particular sites, as well as by other production costs.
For example, the tendency for a number of primary and secondary firms to cluster around the site of raw materials or other inputs may result in the establishment of service firms whose operations reduce such firms’ production cost.
Such agglomeration tendencies are also encouraged if there are enough firms producing by-products to support other firms that might buy and process them. Once an industry beings to grow in a particular place, its firms attract customers and specialized services. The existence of such customers and services may tend to reduce the primary firms’ costs and increase their revenues.
ADVERTISEMENTS:
An agglomeration is a point on the earth’s surface at which economic activity is particularly dense. A metropolitan area is a spatial concentration of industry. Economies of agglomeration are those savings in production costs that occur when factories locate near one another.
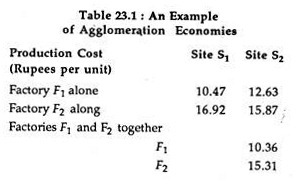
Suppose, for instance, that there are two possible sites, S1 and S2, and two factories F1 and F2 Table 23.1 gives the average production cost for each factory depending on its location. If each one operates in isolation, F1should locate at S1 and F2 at S2. But if both locate at S2 each firm can achieve some cost saving. This is the economy of agglomeration.
There are various sources of agglomeration economies. It is quite obvious that if the factories sell goods to each other, they can reduce transport costs by being adjacent.
As noted by M.J. Webber, “If a steel mill sells hot rolled steel to a nearby can- maker, both save on transporting the steel as well as on the cost of reheating it. If parts manufacturers sell components to a nearby auto factory, there will be saving on transport cost and the personal travel needed to ensure adequate quality control.”
ADVERTISEMENTS:
All these advantages from proximity are savings on transport costs. But, strictly speaking, agglomeration economies are savings in production costs. There are three proximate sources of such economies.
Firstly, there is cost saving due to operation on a scale. Secondly, there are economies of information associated with agglomeration. But the third and the most real source of economy of agglomeration arises from a consideration of social overhead capital — the integrated infrastructure.
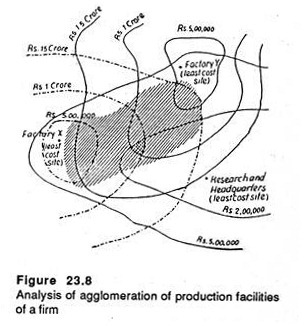
The firm’s decisions can be analysed as follows. To start with, the decision maker has to examine the transport and production costs of each facility in turn. Thereafter, the firm must decide what savings could be achieved if all the facilities were combined. Figure 23.8 shows the savings that the firm could possibly achieve by settings up the headquarters, factories and laboratory in the facility.
Now, around the least cost sites of each single establishment we draw contour lines of production and transport cost, indicating how these costs rise from the least cost site. Thus, for instance, at the Rs. 1 crore isoline around X, transport and production would cost Rs. 1 crore more than at X. We draw such contour lines around each site.
The shaded area in the diagram thus represents all those places at which the total additional costs of operating each facility away from its optimal location are less than the firm’s anticipated savings from agglomeration. These, therefore, appear to be places where the firm could profitably combine its facilities. In Figure 23.8, the facilities should agglomerate.
ADVERTISEMENTS:
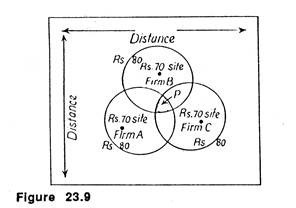
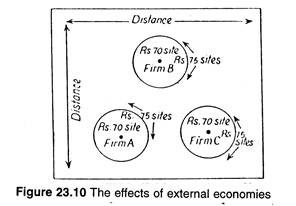
Figures 23.9 and 23.10 depict the effect of external economies resulting from firms agglomerating. The critical isodapanes for these firms are obtained by adding the cost advantages that will accrue to the firms if they agglomerate, to the minimum possible transportation costs.
In Figure 23.9, the cost- reducing benefits from agglomeration (Rs. 10 per unit) more than offset the increases in transportation costs that will occur if the firms locate together somewhere else.
But agglomerations of firms are not any more inevitable when there are cost advantages, than are movements to geographic areas with lower labour costs. The gains may not outweigh the costs.
Figure 23.10 depicts the same firms when there are fewer cost savings (only Rs. 5 per unit) from locating together. In this case, the cost-reduction benefits from agglomeration are not sufficient to offset the higher transportation costs that will exist if the firms locate at the same site.
Why Firms Move?
ADVERTISEMENTS:
Pressures that tend to change the location of economic activity are constantly arising in most nations. New raw material sites are discovered or old ones exhausted, or new production techniques and products are developed, or new customers are found, or new modes of transportation are put into service.
The development of the European Common Market, for example, made it possible for labour to leave southern Italy, for jobs in Germany and other member countries. This tended to reduce the need for grocery stores and other secondary firms in south Italy.
On the other hand, the relatively cheap labour of the south attracted primary firms that might otherwise have located elsewhere. The reduction of transportation costs via the extension of modern highways into the area had the same effect.
Sometimes, external diseconomies occur with the concentration of primary and secondary firms in a specific area, that motivates firms to move. Agglomeration may, for example, result in additional costs related to such things as congestion, pollution, and crime.
When such costs are too high relative to advantages of transportation or factor costs, firms may well leave the existing high-density grouping of firms and factories, substituting the costs and revenues of other locations for those of the locations they have left.
New York has numerous service firms and customers, supporting the tendency for primary firms to locate there. But it also has relatively large amounts of crime, congestion, and pollution, resulting from its many firms and people. If crime, congestion, and pollution continue to rise in New York relative to costs of other possible production sites, firms located there may relocate. Some already have.
ADVERTISEMENTS:
Location changes occur also when technologies change. For example, the development of huge petroleum tankers and ore carriers has made it possible to use foreign raw materials and to locate efficient refineries and steel mills on the oceanfront rather than at the sites of domestic raw materials.
That is why American steel producers located near iron ore and coal mines today, face a severe competitive challenge from Japanese firms using modern ships.
Similarly, the growth of the American trucking and air freight industries has reduced the need for some firms to locate along railroad lines to be able to transport their products. In the same vein, the development of by product uses for petroleum and meat products has virtually eliminated the weight losses of refineries and meat packers.
Now that nothing is thrown away and their products do not weigh less than their inputs, it tends to cost no more to ship the raw materials than it does to ship their finished products. This has reduced the need of refineries and packers to locate near the sources of their raw materials.
On the other hand, the development of modern power transmission lines has reduced the need for electricity generating plants to locate near their customers. Now they can locate thousands of miles away.
Government incentives in the form of lower taxes, direct subsidies, and special prices for inputs such as electricity and water may also encourage firms to locate in areas where they would not otherwise. But such incentives must be sufficient enough to overcome the higher transportation and other costs associated with such sites.
Major Locational Influences:
1. Customers
2. Raw materials availability
3. Labour conditions
4. Transportation costs
5. Electricity costs
6. Natural gas costs
7. Availability of water
8. Climate or weather conditions
10. Government taxes and benefits
11. State and local inducements.
