
In this article we will discuss about the relation between price and total revenue of a firm with the help of diagram.
If a firm increases the price of its product, then as a consequence, whether its total revenue (TR) will increase or not, would depend on the nature of the elasticity of demand for its product. If the demand decreases more than in proportion to the increase in price (i.e., if e > 1), then TR would fall as p increases.
On the other hand, if demand decreases less than in proportion to the increase in price (i.e., if e < 1) then TR would increase as p increases.
Again, if demand decreases proportionately with increase in price, then, even if p increases, TR would remain unchanged. Remember that the expenditure of the buyers and the revenue of the seller are, in fact, the same thing, then there also, i.e., have to get actually the same relations.
ADVERTISEMENTS:
The same relations is obtained in terms of mathematics also in the following way:
It is obtained:
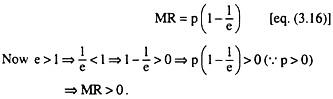
Therefore, here, as p decreases and q increases, TR would increase (since MR is positive). On the other hand, as p increases and q decreases, TR would decrease (since MR is positive).
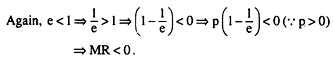
Therefore, here, as p decreases and q increases, TR would decrease (since MR is negative). On the other hand, as p increases and q decreases, TR would increase (since MR is negative).
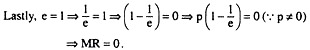
Therefore, in this case, as p decreases and q increases, or, as p increases and q decreases, TR would remain unchanged (since MR = 0).
It may be conclude:
ADVERTISEMENTS:
(a) If e > 1, or, the demand for the good is relatively elastic, an inverse relation between p and TR is obtained, and a direct relation between q and TR.
(b) If e < 1, or, demand is relatively inelastic, a direct relation between p and TR is obtained, and an inverse relation between q and TR.
(c) If e = 1, or, demand is unitary elastic, a change in p and the resulting change in q cannot influence TR.
These relations between p and q and TR is expressed, in terms of Fig. 3.4, where the straight line AR and MR curves of the firm in Fig. 3.4(a) is drawn and the parabolic TR curve in Fig. 3.4(b). In this figure, when q < OQ0 and e > 1, TR increases when q increases (and p = AR diminishes).
Again, at q = OQ0, e = 1 and MR = 0 and TR = maximum. At the point Q0, TR remains unchanged, implying MR = 0, when there is an infinitesimally small change in q. Beyond this, when q > OQ0 and e < 1, TR decreases as q increases (and p = AR decreases).

Example 1:
The consumer’s demand curve for X is P = 100 -√Q. Find his point-elasticity of demand for X when P = 60.
Solution:
ADVERTISEMENTS:
The consumer’s demand curve for good X is given to be
P = 100 – √Q (1)
To calculate his point elasticity of demand for X at P = 60. Do this as.

ADVERTISEMENTS:
ADVERTISEMENTS:
Therefore, the coefficient of point price elasticity of demand for X is -3 and its numerical value is 3.
ADVERTISEMENTS:
Example 2:
The total revenue from the sale of a good is R = 100 Q − 2Q2. Find the value of price- elasticity of demand for X at MR = 20.
Solution:
The total revenue function is given as
