Let us make an in-depth study of the impact of cost on output cost.
A business that is fluctuating its operations needs to predict how costs will change as output changes Estimates of the costs can be obtained from the cost function; which relate the cost of production to the level of output and other variables.
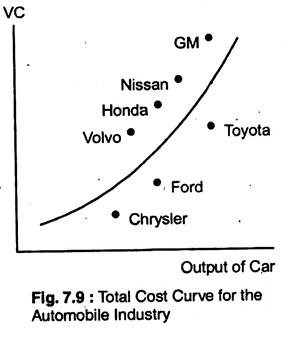
Suppose we want to find out the short-run costs of production in the automobile industry. An empirical estimate of the VC curve can be obtained by using data for individual firms in an industry.
Fig 7.9 shows a typical pattern of cost and output data. Each point on the figure relates the output of a particular auto company to that firm’s variable cost of production. To predict cost reasonably accurately, we need to determine as accurately as possible the relationship between variable cost and output.
ADVERTISEMENTS:
Then, if a company expands its production, we can calculate what the associated cost is likely to be. The curve in the figure shows a reasonably close fit to the cost data (least-squares regression would be used to fit the curve to the data). But the most appropriate shape of curve would be represented algebraically.
The following discussion would give us some idea:
The linear cost function is easy as given below but it is applicable only when MC is constant: VC = α + βQ……… (1)
ADVERTISEMENTS:
For every unit increase in output, variable cost increases by β so the linear cost curve implies a constant MC of production.
If we wish to use a U-shaped AC curve and a MC that is not constant, we must use a more complex (the quadratic) cost function as given: VC = α + βQ + γQ2……….. (2)
This implies a MC = β + 2 γQ. Here, the relationship between MC and output is linear – the MC is a straight line, MC increases with output if γ is positive, and decreases with output if γ is negative. AC = α/Q + β + γQ, is U-shaped when γ is positive.
If the MC is not linear, we might use a cubic cost function:
ADVERTISEMENTS:
VC= α + βQ + γQ2 + δQ3…….. (3).
It implies U-shaped MC and AC curves:
As with production function, cost functions can be difficult to measure.
First, output data often represent an aggregate of different types of products. Total automobiles produced by a firm for example, involves different models of cars.
Second, cost data are normally obtained from accounting information which excludes opportunity costs.
Third, allocating maintenance and other costs to a particular product is difficult when the firm is a conglomerate. Problems like these can limit the accuracy of statistical cost studies.
