
Loanable Funds Interpretation of the IS Curve (With Diagram)!
It is possible to suggest an alternative interpretation of the IS curve by referring to the dual role of the rate of interest in the circular flow model of national income.
Prima facie, the interest rate affects the supply of and demand for goods and services.
It also affects the supply of — and demand for — loanable funds.
ADVERTISEMENTS:
These two are two different sides of the same coin.
i. Equilibrium in the Product Market:
The product market or the market for goods and services is in equilibrium when the supply of and the demand for the economy’s output are equal:
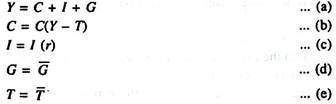
These equations represent the demand side of the economy where the demand for economy’s output comes from C, I, and G shown by equation (a). And each component of aggregate demand has its own determinants.
ADVERTISEMENTS:
The supply side of the economy is represented by the aggregate production function:
![]()
Since factors of production (K and L) are assumed to remain constant, the quantity of output produced (supplied) is always at its potential level as shown by equation (g).
ADVERTISEMENTS:
By substituting the consumption function and the investment function into the national income accounting identity, we have
![]()
Since the variables G and T are exogenously determined, and the factors of production as also the production function determine the quantity of output supplied to the economy, we get
![]()
Thus the supply of output equals its demand.
In equation (i) only r remains undetermined. The reason is that it must adjust to ensure that the demand for goods equals its supply. The higher is r, the lower the volume of I and thus the lower the demand for goods and services (C + I + G). If r is very high, I is too low and the demand for output falls short of the supply:
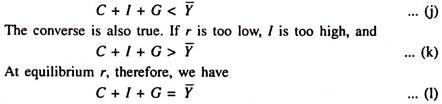
In order to get a clear picture of how r adjusts (moves up or down) to balance the supply and demand for goods and services, we have now to consider equilibrium in the financial market.
ii. The Equilibrium in the Financial Market:
ADVERTISEMENTS:
The financial market reaches equilibrium when the supply of and demand for loanable funds are in balance. In the context of the financial market in which r is both the cost of borrowing and the return to lending we can now present the national income identity as
![]()
The term (Y – C – G) is saving (S). So S = I, i.e., saving equals investment.
National saving has two components — private saving (K- T- C) and government saving (T – G). So we get
ADVERTISEMENTS:
![]()
Thus the inflows into the financial market (private and public saving) must balance the outflows from the financial market (investment).
Now by substituting C (Y – T) and I (r) into the national income accounting identity we get
![]()
ADVERTISEMENTS:
Or, supply of loanable funds = demand for loanable funds.
Since G = G̅, T = T̅ (by policy) and Y = Y̅ (by fixed factor of production and the production function), we get
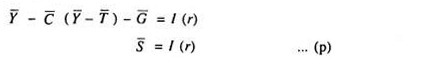
Thus S̅ depends on Y, G and T. Since all the three variables have fixed values, S also remains fixed and does not depend on r (by assumption). But I is a function of r, i.e., I varies inversely with r — a rise in r reduces profitable investment opportunities.
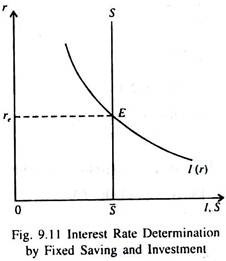
In Fig. 9.11 S is interpreted as the supply of loanable funds and I as the demand for loanable funds. The equilibrium rate of interest re is determined by the saving-investment process. At this rate, the households’ desire to save balances the firms’ desire to invest, and the quantity of loanable funds demanded (here I) equals the quantity supplied (S). If I > S, r will rise, and, if S > I, r will fall.
ADVERTISEMENTS:
Thus both from national income accounting system of a country and from the SKM we find an equivalence between the supply of and the demand for goods and services and those of loanable funds. This equivalence enables us to suggest an alternative interpretation of the IS curve.
Equation (p) shows that the supply of loanable funds depends on income and fiscal policy. The demand for loanable funds depends on r. Here r moves up or down to bring about equilibrium in the market for loanable funds.
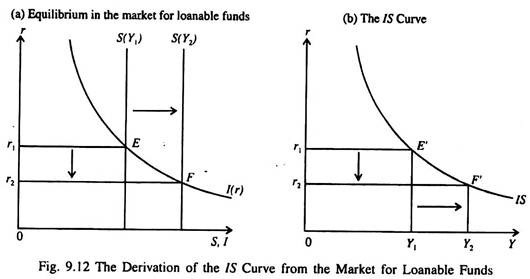
The derived of the IS Curve:
We may now derive the IS curve from the equilibrium condition in the market for loanable funds. The IS curve shows the interest rate that brings about equilibrium in the market for loanable funds, income remaining constant. When income rises from Y1 to Y2 national saving (S) = Y – C – G increases but by less than Y since MPS < 1.
Fig 9.12 (a) shows that the increased supply of loanable funds pushes down the rate of interest from r1 to r2. As a result investment and income increase. Fig 9.12 (b) shows that an increase in income (which implies higher saving) implies a low equilibrium rate of interest. Due to this inverse relation between r and Y, the IS curve slopes downward from left to right.
In this case also a change in fiscal policy will shift the IS curve. If G increases, or T falls, S will fall if Y remains constant since
![]()
A cut in T will increase C and reduce Y̅ – C – G, The consequent fall in the supply of loanable funds raises r and equilibrates the market for loanable funds. Since r is now higher at a fixed level of Y, the IS curve shifts upward in response to the expansionary fiscal policy (which works through an increase in G or a cut in T or both at the same time).
Thus the IS curve is a relationship between Y and r arising from either the commodity market or the market for loanable funds.