
Effects of Financial Market Deregulation (With Diagram)!
Since 1991, there have been various types of deregulation and innovations in Indian financial markets.
These have altered the menu of assets that are available for households and businesses to hold and are likely to change the definition of money supply.
Moreover the deregulation of financial markets can increase the volatility of interest rates.
ADVERTISEMENTS:
In the pre-reform period (before July 1991) the RBI regulation put ceilings on the interest rates that could be paid on various types of deposits by banks and other financial (depository) institutions. Now commercial banks and other banking institutions can fix their own rates of interest.
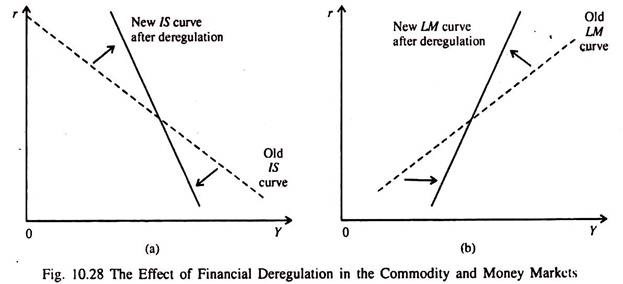
Deregulation caused the IS curve to become steeper — IS’ in Fig. 10.28. Another reason for this is introduction of new types of deposits by banks, money market mutual funds, investment companies and insurance companies with flexible interest rates, the development of asset-backed securities and adjustable interest rate on mortgages (such as home finance and car loan).
This is why the IS curve has become steeper. See Fig. 10.28. The LM curve has also become steeper — LM’ in Fig. 10.28(b) because a given increase in r in financial markets does not cause reduction in the demand for money as it did in the past when interest rate ceilings on savings and time deposits were fixed by the RBI.
In fact, the system of administered rate of interest led to the withdrawal of funds from non-banking savings institutions such as post-offices when market interest rates rose above the interest rate ceilings. There was a shift toward bonds, T-bills, and money market mutual funds and away from depository institutions.
ADVERTISEMENTS:
Due to fall in the rate of interest on bank deposits, people hold more transactions balance and have less incentive to reduce their current account deposits in banks for buying income- earning assets like bonds. This is why the demand for money function and the LM curve have become steeper in Fig. 10.28(b).
Effects on Interest Rates:
Perhaps the most notable effect of deregulation is likely to be increased volatility of interest rates. In Fig. 10.29(a) the LM curve shifts to the left by the same horizontal distance as the result of a decision by the central banks to tighten monetary policy. In Fig. 10.29(a) where we show the economy before deregulation, a fall in M leads to a slight increase in r (from r0 to r1) because both the IS and LM curves are relatively flat. In Fig. 10.29(b) we show the economy after deregulation. In this case there is a much greater increase in r (from r0 to r2).
ADVERTISEMENTS:
Thus, as a result of the steeper curves, a given leftward shift in the LM curve creates a much larger increase in r under the new deregulated environment. However, it is not possible to say whether Y fell more after deregulation than before deregulation.