Changes in Government Spending (With Diagram)!
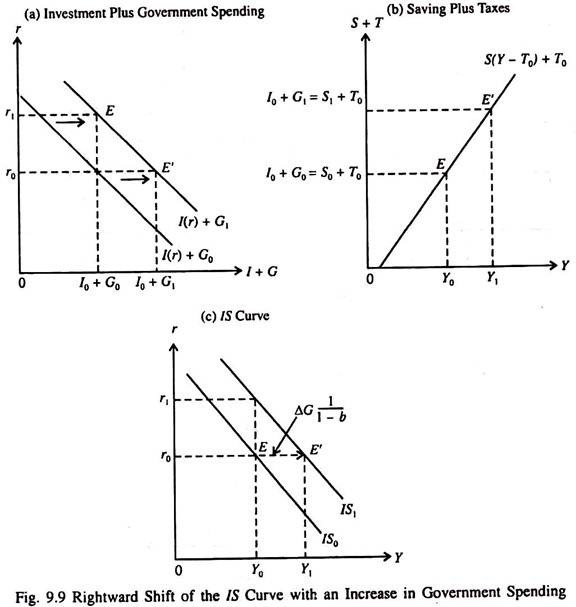
If government spending increases to G, in Fig. 6.9(a) the combined investment plus government spending curve shifts out to the right from I0 + G0 to I0 + G. At a fixed interest rate r0 investment will remain unchanged, and I0 + G, is greater than I0 + G0 by ΔG = G1 – G0).
In order to maintain equilibrium (given by the condition I + G = S + T), with a fixed level of taxes, saving has to rise from S0 to S1, which requires income to rise from K0 to K, in part (b).
At interest rate r0 the equilibrium point in the product market shifts from E to E’. Thus an increase in G shifts the IS curve to the right from IS0 to IS1 in part c.
ADVERTISEMENTS:
The IS curve shifts by the horizontal distance E to E’ when G increases by ΔG. The horizontal shift of the IS (e.g., distance EE1) is that amount of the increase in income required to generate new saving equal to increase in government spending.
Since the increased saving is MPS times Δ Y, the required increase in Δ Y (the horizontal shift of the IS curve) will be AG = AS = (1 – b) Δ Y. So the amount of such shift of the IS curve per unit increase in G is [1/(1 – b)], the autonomous expenditure multiplier. In terms of Fig. 9.9
EE’ = ΔY = Y1– Y0 = ΔG (1/1 – b) … (9)
r and therefore I remaining constant. Here the multiplier effect is present due to induced increase in consumption caused by rising government spending, with investment remaining fixed.
i. Autonomous Change in Investment:
An increase in MEC caused by a favourable shift in expectations about the future profitability of investment projects increases investment demand corresponding to each interest rate. As a result the I(r) curve shifts to the right and, hence, the combined I + G curve to the right in Fig. 9.9(a).
This rightward shift of the I(r) curve, by the amount of the autonomous increase in investment, has exactly the same effect on the IS curve as an equal increase in G, as shown in Fig.9.9(c). Each type of change (an increase in I or G) shifts the I + G curve and this shift, in turn, shifts the IS curve to the right the autonomous expenditure multiplier [1/(1 – b)] times the increase in G, or increase in I.
ii. Changes in Taxes:
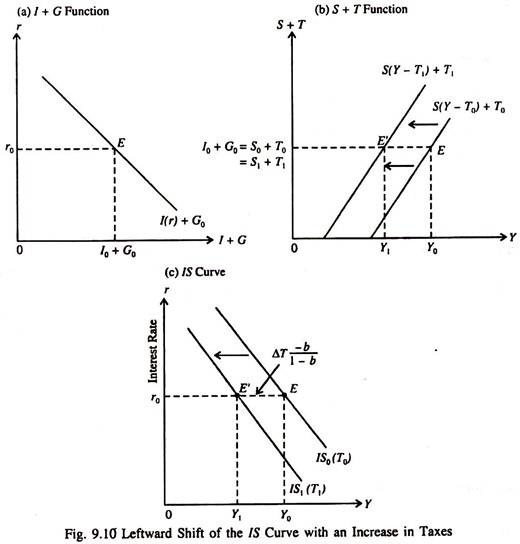
Since taxes are leakages from the circular flow of income, an increase in taxes shifts the S + T schedule to the left in part (b). At the same interest rate r0 which fixes I0 and thus I0 + G0, saving and, therefore, income must fall to maintain the equilibrium condition in the commodity market: I + G = S + T.
After the tax increase, income falls from Y0 (point E) to Y1, (point E) in order to ensure product market equilibrium at the original interest rate r0 in Fig. 9.10.
Magnitude of Shift:
In this case magnitude of the shift of the IS curve is equal to the tax multiplier times the increase in the tax total (ΔT). This point may now be explained. Since saving plus taxes must remain unchanged for new equilibrium to occur at the same rate of interest, the increase in taxes has to be exactly offset by a fall in saving:
0 = ΔS + ΔT
In this case the change in saving is
ΔS = (1 – b)Δ(Y – T) = (1 – b)ΔY – (1 – b)ΔT
So, for the equilibrium condition I(r) + G = S(Y-T) + T to hold requires that
ΔS + ΔY = 0
(1 – b) ΔY- (1 – b) ΔT + ΔT = 0
(1 – b) ΔY – ΔT+ bΔT+ ΔT = 0
ADVERTISEMENTS:
(1 – b) ΔY + bAT= 0
(1 – b) ΔY= -bΔT
AY = [-b/(1-b)]ΔT …(10)
with r remaining constant at r0.
ADVERTISEMENTS:
Thus income has to fall for product market equilibrium at r0 with a higher level of taxes. Moreover, the magnitude of the leftward shift of the IS curve for a one-unit increase in taxes, -b/( 1 – b) is the tax multiplier of the SKM.
The tax multiplier indicates the horizontal shift of the IS curve per unit changes in taxes, when the interest rate and the volume of investment remain fixed. In other words, the tax multiplier indicates the change in equilibrium income per unit change in taxes for a given level of investment.
So fiscal policy variables affect the position of the IS curve. But changes in G or T do not alter the slope of the IS curve.

