Read this article to learn about the fifty two frequently asked questions on the Producer Behaviour and Supply.
Q.1. Explain the concept of a production function.
Ans. i. A production function shows technological relationship between factors of production and output of a firm.
ii. It shows the maximum output that can be produced with a given quantity of factors of production.
ADVERTISEMENTS:
iii. If we assume that labour (L) and capital (K) are the only two factors of production then production function can be written as
Q = f (UK)
Where Q = Output
L = Units of labour
ADVERTISEMENTS:
K = Units of Capital
iv. But since labour and capital are not the only factors required for production, the production function is to be expressed as
Q= f(f1, f2 ,f3…fn)
Where Q is the output and f1, f2…. are the factors of production.
ADVERTISEMENTS:
Q.2. Explain the relationship between the marginal product and the total product of an input.
Ans. The relationship between total product (TP) and marginal product (MP) is as follows:
(i) Marginal product (MP) at any point on the total product (TP) curve is the slope of the TP curve at that point.
(ii) When MP increases, TP increases at an increasing rate.
(iii) When marginal product starts falling but is positive, total product increases at the diminishing rate.
(iv) When marginal product is zero, total product is maximum.
(v) When marginal product becomes negative total product also starts falling.

We can see that (TP can fall but can never become negative whereas MP can fall and can also become negative.)
Q.3. What does the Law of variable proportion show? State the behaviour of total product according to this law.
Ans. The Law of Variable Proportions shows the pattern of change in total output when only one input is increased, other inputs remaining unchanged.
Phase I:
ADVERTISEMENTS:
TP first increases at an increasing rate.
Phase II:
TP increases but at a decreasing rate.
Phase III:
ADVERTISEMENTS:
TP falls.
Q.4. What does the law of variable proportion show? State the behaviour of marginal product according to this law.
Ans. Law of variable proportions shows the effect on total output when only one input is increased while other inputs are kept unchanged
Phase I Initially MP increases.
Phase II MP decreases but is positive.
Phase III MP decreases but is negative
ADVERTISEMENTS:
Q.5. Giving examples, explain the meaning of cost in economics.
Ans. Cost in economics is the sum of:
(1) Explicit cost which is actual money expenditure on inputs, for example purchase of materials (or any other)
(2) Implicit cost or the estimated value of the inputs supplied by the owners including normal profit, for example estimated salary of the owners (or any other).
Q.6. Distinguish between explicit cost and implicit cost and give examples.
Ans. Explicit cost refers to the actual purchase of inputs, or, actual money expenditure on inputs. Example: expenditure on buying raw materials (or any other). Implicit cost refers to the estimated value of the inputs provided by the owner. Example: estimated salary of the owner (or any other).
ADVERTISEMENTS:
Q.7. Explain the concept of short run and the long run.
Ans. i. Short run is that period in which some factors are fixed and only some are variable. A firm can vary its output only by varying the variable factors. Fixed factors cannot be changed in the short run.
ii. Long run is the period in which all factors of production are variable, which means all factors including building, machinery etc. can also be changed in the long run. Every factor of production is variable. This changes the size and scale of production in long run.
Q.8. What are the average fixed cost, average variable cost and average cost of a firm? How are they related?
Ans. Average fixed cost (AFC):
The fixed cost per unit is called average fixed cost. It is calculated by dividing the total fixed cost by quantity produced.
ADVERTISEMENTS:
AFC =TFC /Q
AFC decreases with the increase in the level of output by the firm. The shape of AFC is rectangular Hyperbola.
Average Variable Cost (AVC):
Variable cost per unit of output produced is called Average Variable Cost. It is obtained by dividing total variable cost by the quantity produced.
AVC =TVC /Q
AVC is U-shaped. It decreases initially and starts rising after reaching the stage of minimum costs.
ADVERTISEMENTS:
Average Cost:
The per unit total cost of output produced is called average cost. It is obtained by dividing the total cost by the quantity produced.
Relationship between Average Cost, Average Fixed Cost and Average Variable Cost:
AC is the sum of AFC + AVC i.e.
AC = AFC + AVC

Q.9. Draw Average Variable Cost, Average Total Cost and Marginal Cost curves in a single diagram.
Ans. Important points for students in the context of above question:
1. Please check that the vertical distance between ATC curve and AVC curve goes on falling.
2. Check that the MC curve passes through the minimum points of the AVC and Arc curves.
3. Check that all components of the diagram are properly labelled.

Q.10. Draw Total Variable Cost, Total Cost and Total Fixed Cost Curves in a single diagram.
Ans. Important points:
1. TFC curve is parallel to the X axis.
2. TC/TVC curve is concave in the beginning and convex afterwards.
3. TC curve starts from the point from where the curve starts and is parallel to the TVC curve.

Q.11. Define marginal cost. Explain its relation with average cost.
Ans. Marginal costs is the addition made to total cost by producing an additional unit of a commodity. MC is addition to total cost on producing one more unit of output. When MC < AC, AC falls MC = AC, AC is constant MC > AC, AC rises.

Q.12. Define variable cost. Explain the behaviour of total variable cost as output increase.
Ans. The cost which changes with change in output is VC. Behaviour of TVC 2 phases.
1. Initially, as output is increased, TVC rises at a decreasing rate.
2. After a level of output, TVC increases at an increasing rate.
Q.13. Why does SMC curve cut the AVC curve at the minimum point?
OR
What is the relation between MC & AVC?
Ans. The relationship between MC and AVC is as under:
(i) At the first unit of output MC and AVC are the same.
(ii) MC curve passes through the minimum point of the AVC curve i.e. point P.
(iii) When MC is below AVC, AVC falls. (OR) MC < AVC
(iv) When MC is above AVC, AVC rises and (OR) MC > AVC
(v) When AVC is minimum, MC = AVC.

Q.14. Why is the short run marginal cost curve U-shaped?
Ans. MC is addition made to TC or TVC, when an additional unit of a commodity is produced:

MC = ∆TC/∆Q
Or MC= ∆ TVC/∆Q
MC is the slope of TC curve at each point. MC curve is U shaped because of the application of law of variable proportion. When MP increases MC will fall and when MP decreases MC will rise. Thus MC curve falls initially, reaches its minimum point and ultimately rises.
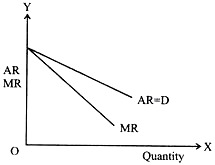
Q.15. Draw average revenue and marginal revenue curves in a single diagram of a firm which can sell more units of a good only by lowering the price of that good. Explain.
Ans. When a firm can sell more only by lowering the price the AR curve is downward sloping. When AR is falling, MR must be less than AR.
Therefore, MR curve lies below the AR curve:

Q.16. Draw in a single diagram the average revenue and marginal revenue curves of a firm which can sell any quantity of the good at a given price. Explain.
Ans. In such a market whether the firm sells more or less it does not affect the market price. It makes the AR curve parallel to the x-axis so that whether quantity produced is OQ1 or OQ2, market price remains unchanged. Since AR is unchanged AR must be equal to MR. The MR curve thus coincides with the AR curve.
Q.17. Explain the relation between average revenue and marginal revenue of a firm which is free to sell any quantity at a given price.
Ans. In such a market whether the firm sells more or less, it does not affect the market price. It makes average revenue constant as output increases. According to marginal-average relationship, when AR is constant MR equal AR throughout.

Q.18. What is the ‘price line’? Explain
Ans. i. Since market price is fixed, price line will start from the y axis at the price level equal to the market price of the commodity and will be a horizontal line parallel to x-axis.
ii. The price line shows that a firm can sell any quantity it produces at the prevailing market price.
iii. The above figure shows that the market price P is not affected by the level of output of the firm.

Q.19. Why is the total revenue curve of a price taking firm an upward sloping straight line? Why does the curve pass through the origin?
Ans. i. TR = P X Q
ii. Since TR = P x Q is a straight line equation. TR curve will be a straight line.
iii. The TR will increase when more output is sold, it will thus be an upward rising straight line.
iv. Under perfect competition price remains constant, thus TR will increase in the proportion of output sold. And at the same time TR = ≥MR or MR=TRn – TR n-1. But MR remains constant throughout perfect competition that’s why TR is upward sloping with a constant rate. And at zero level of output no revenue is generated, and TR curve starts from origin.

Q.20. What is the relation between market price and average revenue of a price-taking firm?
Ans. Average revenue (AR) is the per unit revenue of output sold.
AR= TR/Q
If market price = P
And quantity sold = Q
TR = P x Q
Putting the value of TR in (1), we get
AR = P x Q / Q
AR = P
Thus for a price-taking firm average revenue is equal to the market price of the commodity.
Q.21. What is the relationship\between market price and marginal revenue of a price taking firm?
Ans. Marginal revenue is the addition to total revenue, that is when an additional unit of output is sold. Let the present output be Q and price be P.
and output is increased from Q to (Q + 1)
MR = TRn– TRn– 1 (OR)
MR = TR from output
(Q + 1) – TR from output Q.
= P x (Q + l) – P x Q =
PQ + P – PQ
= P.

Thus for a price taking firm marginal revenue is equal to the market price of the commodity sold.
Q.22. What conditions must hold if a profit maximising firm produces positive output in a competitive market?
Ans. The following three conditions must be satisfied when a profit maximising firm produces positive output (say O) in a competitive market.
(i) The market price at output level ‘O’ must be equal to the MC. (MR = MC)
(ii) MC curve should be increasing.
(iii) In the short run the market price (P) must cover the Variable Cost i.e. market price > Variable Cost at the output level ‘O’. In the long nm market price (P) should be greater than or equal to the AC (P > AC) at the output level ‘O’.
Q.23. Will a profit maximising firm in a competitive market produce a positive level of output in the short run if the market price is less than the minimum of AVC? Give explanation.
Ans. i. No, in the short run price should cover at least the Variable Cost of production.
ii. Thus, Price = minimum AVC is the shut-down point.
iii. No firm will operate if the price is less than minimum of AVC or in other words prices are not able to cover Variable Cost.
Q.24. Can a firm operate when its price is below minimum of its AC? Give an explanation.
Ans. i. No, there is free entry and exit of firms in the long run which means that all firms will be earning normal profits only.
ii. The firm will be producing only when the market price = minimum AC, because its price is below the minimum AC, no firm would produce as if would result a loss to the firm.
Q.25. What does the price elasticity of supply mean? How do we measure it?
Ans. i. The ratio of percentage change in quantity supplied to a percentage change in price of the commodity is called price elasticity of supply.
ii. Elasticity of supply (es) can be measured with the help of following formula
es= P/Q x ∆Q/∆P
Where P = Original Price
Q = Original Quantity Supplied
Then ∆P = Change in Price
And ∆Q = Change in Quantity Supplied
Q.26. A firm earns a revenue of Rs 50 when the market price of a good is Rs 10. The market price increases to Rs 15 and the firm now earns a revenue of Rs 150. What is the price elasticity of the firms supply curve?
Ans. When P = Rs 10 TR = Rs 50
Q = 5units
When P1 = 15 TR = Rs 150
Q1 = 10 units
es = ∆Q/∆P x P/Q= 5/5 x 10 /5=2
es =5
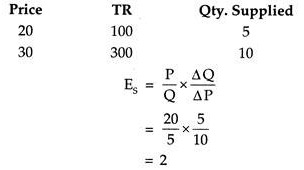
Q. 27. When the price of a good rises from Rs 20 per unit to Rs 30 per unit, the revenue of the firm producing this good rises from Rs 100 to Rs 300. Calculate the price elasticity of supply.
Ans.
Q.28. At the market price of Rs 10, a firm supplies 4 units of output. The market price increases to Rs 30. The price elasticity of the firm’s supply is 1.25. What quantity will the firm supply at the new price?
Given
Ans. P=Rs 10
Q= 4units
P1= Rs30
Q1= x
∆P= (30-10) = Rs 20
∆Q = (x-4)
es = 1.25
By Formula es = ∆Q/∆P P/Q
1.25= (x-4)/20 10/4
8 x 1.25 = x-4
X = 10+4
X = 14 units
New quantity supplied by the firm = 14 units
Q.29. Show the relationship between TVC and MC curves.
Ans. The relationship between TVC and MC is as under:
(i) When MC declines, TVC rises at a diminishing rate.
(ii) When MC rises, TVC rises at an increasing rate.
(iii) TVC is equal to the sum of MC. Graphically it is the area under MC curve.
(iv) MC is the slope of TVC curve, which declines, reaches minimum and then starts rising and acquire a U shaped curve.
(v) TVC is the addition to MC.
TVC = ∑MC (or) MC = TVCn – TVC n—1
Q.30. What is the difference between stock and supply? Give an example.
Ans. i. Stock is the total quantity of a commodity that a seller has at a particular point of time and supply is only a part of stock which the seller is willing to sell at a particular price in a given time period.
ii. Suppose a producer has produced 2,000 units, but at the prevailing market price of Rs 20 per unit, he is ready to sell only 1,250 units of the commodity. His stock will be 2,000 units and his supply at Rs 20 per unit will be 1,250 units.
Q.31. Explain how the supply of a commodity is affected by the change in the price of other commodities?
Ans. i. The supply of a commodity gets affected by the prices of related goods or substitute goods.
ii. If prices of substitute goods rise, their production becomes more profitable and producer prefer to produce those goods whose prices have increased.
iii. Thus the supply of the commodity whose prices have not increased gets affected.
iv. Hence an increase in the price of related goods decreases the supply of the commodity and a decrease in the price of substitute goods increases the supply of a commodity.
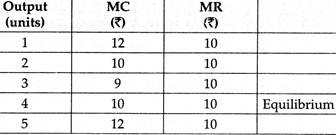
Q.32. Explain the conditions of producer’s equilibrium with the help of a numerical example.
Ans. The conditions are:
(1) MC = MR
(2) MC > MR after equilibrium.
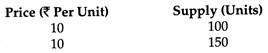
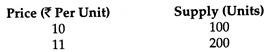
Q.33. Explain the meaning of ‘increase in supply’ and ‘increase in quantity supplied’ with the help of a schedule.
Ans. Increase in Supply:
It refers to rise in supply of good due to change in a factor other than the own price of the good. For example, in the following schedule given own price of the good remaining the same at Rs. 10 per unit, supply rises from 100 units to 150 units.
Increase in quantity supplied:
It refers to rise in supply of a good due to rise in own price of the good only. For example in the following schedule own price rises from Rs 10 to Rs 11 per unit and as a result, supply rises from 100 units to 200 units.
Q.34. Distinguish between decrease in supply and contraction of supply.
Ans. Distinction between decrease in supply & contraction of supply is as under:

Q.35. Distinguish between increase in supply & expansion of supply.
Ans. Difference between increase in supply and expansion of supply is as follows:

Q.36. Explain the law of supply. Use diagram.
Ans. According to law of supply, if all other factors affecting supply remain constant, the supply will be more at a higher price and it will be less at a lower price, i.e., the quantity supplied and price of the commodity are directly related.
Assumptions:
(1) Prices of related goods are same.
(2) Technology remains the same.
(3) The cost of production is same.
(4) The goals of the firm are not changing.
(5) The expected prices are same. In the above diagram, SS is the supply curve.
Originally OQ quantity was supplied when the price of the commodity was OP. When price increased from OP to OP1 the quantity supplied increased from OQ to OQ1.
Thus it is evident from the above diagram that the relation between the price and supply is in same direction.

Q.37. A severe cyclone results in tremendous fall in the output of rice. Analyse how will it affect the market price and quantity of rice?
Ans. Due to severe cyclone, production of rice will fall drastically, causing supply of rice to fall and so supply curve will shift towards left.

Supply curve will shift towards left from SS to S1S1. Equilibrium price will rise from OP to OP1 and equilibrium quantity will fall from OQ to OQ1.
Q.38. Using supply and demand curves, show how an increase in the price of shoes affects the price of a pair of socks and the number of pairs of socks bought and sold.
Ans. i. Increase in the price of shoes will lead to decrease in demand for socks as these are complementary goods.
ii. In the diagram DD and SS are demand and supply curves and equilibrium price is OP. With the increase in price of shoes, demand for socks has decreased thus DD has shifted to the left to D1D1, which intersects the supply curve SS at E1 and decreases the equilibrium price from OP to OP1. The equilibrium quantity has also decreased from OQ to OQ1.
iii. Hence with the increase in the price of shoes, equilibrium price as well as equilibrium quantity of socks bought and sold will decrease.

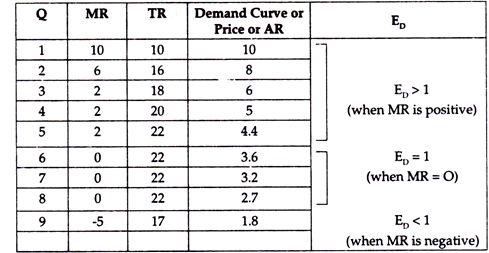
Q.39. What is the value of the MR when the demand curve is elastic?
Ans. When demand curve is elastic (e > 1), MR will be positive. The relationship is as under:
It can graphically be shown as under:
MR= P(1-1/e)
Q.40. Explain how changes in prices of other products influence the supply of a given product.
Ans. i. Suppose price of other products rise.
ii. It makes production of these products more profitable because their cost is in changed.
iii. In comparison it also makes the given product less profitable.
iv. As a result the firm shifts its resources from the given product to the production of other products.
v. Supply of the given product falls.
vi. Similarly, fall in the prices of other products increases the supply of the given product.
Q.41. Explain how changes in prices of inputs influence the supply of a product.
Ans. When prices of input fall, cost falls.
i. Price of the product remaining unchanged, fall in cost leads to rise in profits.
ii. Rise in profit induces the producer to supply more.
iii. Similarly a rise in prices of inputs will lead to fall in supply.
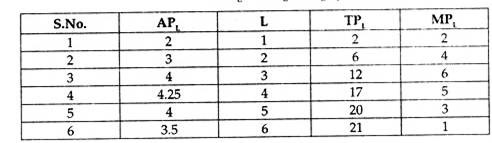
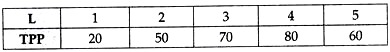
Q.42. The following table gives the average product schedule of labour. Find the total product and marginal product schedules. It is given that total product is zero at zero level of employment.
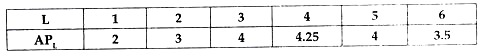
![]()
Ans.
Q.43. Define ‘Market Supply’. What is the effect on supply of a good when Government imposes a tax on the production of that good. Explain
Ans. Market supply is the quantity of a good supplied by a the firms taken together at a given price during a period of time.
Imposition of tax raises cost.
Price remaining unchanged. Profits fall.
As a result supply decreases.
Q.44. What is a supply schedule? What is the effect on the supply of a good when Government gives a subsidy on the production of that good? Explain
Ans. A supply schedule is a schedule that shows the quantity supplied of a commodity at different prices during a period of time. Subsidy raises revenues. Cost remaining unchanged, profits rise. As a result supply increases.
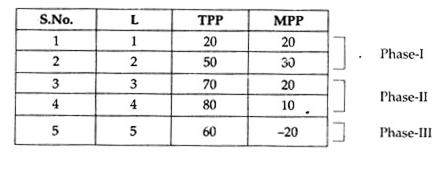
Q.45. Identify the three phases of law of variable proportion from the following.
Ans.
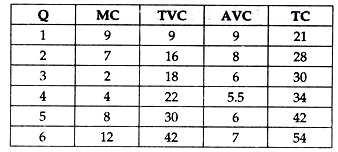
Q.46. Given that fixed cost is Rs 12, Calculate TC, TVC and AVC from the following:
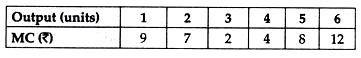
Ans. By formula IMC = TVC, AVC = TVC/Q, TC = TFC + TVC
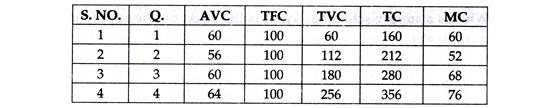
Q.47. Total fixed costs of a firm are Rs 100. Its average variable cost at different levels of output is given. Calculate TC and MC at each level of output.
Ans.

By formula TVC = AVC Q, TC=TFC + TVC and MC=TVCn – TVCn-1
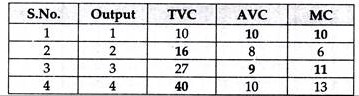
Q.48. Complete the following table.

Ans. By formula AVC = TVC/Q; TVC = AVC x Q; MC = TVCn – TVCn-1
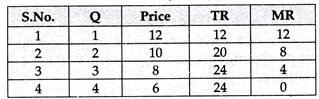
Q.49. Complete the following.

Ans. By formula TR = P x Q, MR = TRn – TRn-1
Q.50. From the schedule provided below calculate the total revenue, demand curve and price elasticity of demand:
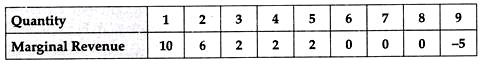
Ans.
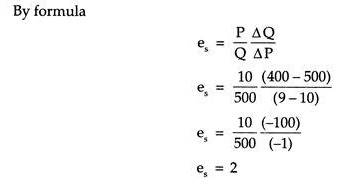
Q.51. The price of a commodity is f 10 per unit and its quantity supplied at this price is 500 units. If its price falls by 10 percent and quantity supplied falls to 400 units. Calculate its price elasticity of supply.
Ans. Given P = 10, Q = 500
Fall in price by 10% = 10/100 x 10 = 1
So, New Price = 10 – 1 = 9
Q1 = 400
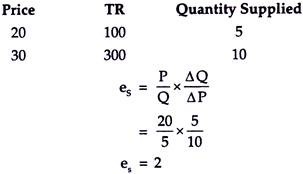
Q.52. When the price of a good rises from Rs 20 per unit to Rs 30 per unit, the revenue of the firm producing this good rises from Rs 100 to Rs 300. Calculate the price elasticity of supply.
Ans.