
Read this article to learn about the top forty-seven frequently asked questions on the Consumer Equilibrium and Demand.
Q.1. Define utility. Explain the relationship between TU and MU curves.
Ans. The extent to which a consumer expects a commodity to satisfy his want for same is known as utility.
The relationship between TU and MU is as under:
ADVERTISEMENTS:
(i) TU increases as long as MU is positive.
(ii) When MU is zero, TU is maximum.
(iii) TU also starts falling when MU becomes negative.

In the above diagram, TU is increasing up to point M since MU is positive till N. TU is maximum at M when MU is zero and after M, TU starts falling since MU has become negative.
ADVERTISEMENTS:
Q 2. Distinguish between ‘increase in demand’ and ‘increase in quantity demanded’ of a commodity.
Ans. When demand rises at the same price it is called ‘increase in demand’. When demand rises due to fall in price it is called ‘increase in quantity demanded’.
ADVERTISEMENTS:
Q.3. Distinguish between decrease in demand and decrease in quantity demanded.
Ans. When demand falls at the same price it is called ‘decrease in demand’. When demand falls due to rise in price it is called ‘decrease in quantity demanded’.
Q.4. Distinguish between change in demand and change in quantity demanded.
OR
Distinguish between shift in demand and movement along the demand curve.
Ans. Distinction between change in demand and change in quantity demanded is as follows:
 Q.5. Explain any two causes of increase in demand of a commodity.
Ans. (1) Rise in price of substitute goods.
(2) Fall in price of complementary goods.
ADVERTISEMENTS:
(3) Rise in income of buyers/consumers in case of normal good.
(4) Fall in income of buyers in case of inferior good.
(5) Favourable change in taste for the good.
Q.6. Explain the ‘law of demand’ with the help of a demand schedule.
ADVERTISEMENTS:
Ans. i. The law of demand states that other things being constant, the demand of a commodity and its price are inversely related to each other.
ii. In other words, if all other factors affecting demand except price of the commodity remain constant demand will be more at a lower price and it will be less at a higher price.
The law of demand can be explained with the help of following demand schedule:

ADVERTISEMENTS:
iii. The above demand schedule shows that with the fall in price of the commodity from Rs 5 to Rs 4 its quantity demanded has increased from 20 units to 25 units and from 25 units to 32 units when the price further falls from Rs 4 to Rs 3 per unit.
iv. The law of demand can also be shown by diagram. As the initial price is OP and initial quantity is OQ respectively. When the Price decreases to OP1 the quantity rises to OQ1.Thus there is inverse relation between the price and the quantity demanded.

Q.7. Explain any two factors that affect price elasticity of demand.
Ans. (I) Nature of the Good:
Demand is inelastic in case of necessities while elastic in case of luxuries.
ADVERTISEMENTS:
(Ii) Number of Substitutes:
More the numbers of substitutes, more the choice the consumer has, and, therefore, more elastic the demand.
Q.8. Explain the effect of the following on the price elasticity of demand of a commodity (i) Number of substitutes (ii) Nature of the commodity
Ans. (a) The more the number of substitutes, the greater the elasticity because more choice is available to the consumer.
(b) Necessities are inelastic. Other goods are relatively more elastic.
Q.9. How is the price elasticity of demand of a commodity affected by the number of its substitutes? Explain
ADVERTISEMENTS:
Ans. More the number of substitutes of commodity, more elastic is likely to be demand of that commodity. For example, suppose the price of the given good rises and the good has many substitutes. In this case the consumer has the option of switching over to the substitutes. As a result the demand of the given good is likely to fall sharply. It makes demand more elastic.
Q.10. What will happen if the price prevailing in the market is:
(i) above the equilibrium price,
(ii) below the equilibrium price.
Ans. (i) a. If the market price is above the equilibrium price, there will be excess supply of the commodity. Every seller will try to sell his products to the limited customers.
b. The competition among sellers will bring the price down to its equilibrium level.
ADVERTISEMENTS:
(ii) a. When the market price is below the equilibrium price, there will be excess demand. Since quantity supplied will be less than the quantity demanded, there will be competition among buyers.
b. Consequently, market price will keep on rising till it reaches the equilibrium level.
Q.11. Suppose the demand and supply curves of salt are given by
Qd = 1000-p
Qs = 700 + 2p
(a) Find the equilibrium price and quantity
ADVERTISEMENTS:
(b) Now suppose that the price of an input to produce salt has increased, so that the new supply curve is
QS = 400 + 2p
How does the equilibrium price and quantity change? Does the change confirm to your expectation?
(c) Suppose the government has imposed a tax of Rs 3 per unit on sale of salt. How does it affect the equilibrium price and quantity?
Ans. (a) Equilibrium price is achieved when
Qd = Qs
1000 – p = 700 + 2p
3p = 300
P = 100
Equilibrium price = R100
Putting the value of equilibrium price in demand curve equation.
Qd = 1000 – p = 1000 -100 = 900
Equilibrium quantity is 900 units.
(b) On increase in the price of input new supply curve is
Qd = 400 + 2 p
New equilibrium is where
Qd=Qs
1000-p = 400 + 2p
3p = 600
P = 200
Substituting P = 200 in demand equation
Equilibrium quantity = Qd= 1000-p
= 1000-200
= 800 units
On comparing both cases, we conclude that, equilibrium prices increases and equilibrium quantity decreases due to rise in price of inputs.
(c) When tax of Rs 3 per unit is imposed on sale of salt new supply curve becomes:
Qs = 700 + 2 (p- 3)
QS = 700 + 2p-6
= 694 + 2p
New equilibrium is where Qd = Qs
1000-p = 694 + 2p 1000 – 694 = 3p
3p = 306
P = 102
Equilibrium price = Rs 102
Substituting p = 102 in demand equation
Equilibrium quantity = 1000 -102 = 898 units.
Thus, equilibrium prices increases and equilibrium quantity falls when per unit tax is imposed on sale of salt.
Q. 12. Explain how the demand for a good is affected by the price of its related goods. Give examples.
Ans. Related goods are either substitutes or complementary:
Substitutes:
When price of a substitute falls, it becomes cheaper than the given good. So, the consumer substitutes it for the given good. Hence the demand for the given good will decrease. Similarly, a rise in the price of substitute will result in increase in the demand for given good. For example Tea and Coffee.
Complementary:
When the price of a complementary good falls (raises), its demand rises (falls) and the demand for the given good will increase (decrease), for example pen and ink.
Q.13. Explain Law of Diminishing Marginal Utility with the help of a total utility Schedule.
Ans. The law of diminishing marginal utility states that as a consumer consumes more and more units of a good, marginal utility from each successive unit consumed goes on falling as is shown in the following schedule:
 Q.14. Goods X and Y are substitutes. Explain the effect of fall in price of Y on demand.
Ans. When price of Y falls, X becomes relatively dearer. This reduces demand for X as Y will be substituted for X.
Q.15. What are the assumptions of law of diminishing marginal utility?
Ans. The assumptions of law of diminishing marginal utility are as under:
(i) Standard Units:
The law will not hold good if units consumed are too small or too large. For example, if water is consumed in drops, the law may not hold good.
(ii) Continuous Consumption:
All units should be consumed continuously. There should be no time gap between consumption of two units.
(iii) Homogeneous Units of the commodity:
All units consumed should be homogeneous and perfect substitutes of each other.
(iv) Mental and Social Condition of the consumer should be normal and should not change:
The mental condition of the consumer should be normal and his tastes, preferences, income etc. should not change.
Q.16. How is price elasticity of demand measured by Total Expenditure Method? Explain.
Ans. By Total Expenditure Method, elasticity of demand is measured as under:
(i) If an increase or decrease in price does not affect the total expenditure on the commodity, the price elasticity is unity. (ed = l).
(ii) If an increase in price increases the total expenditure or a decrease in price decreases the total expenditure, the price elasticity of demand is less than unity (ed < l).
(iii) If an increase in price reduces the total expenditure or a decrease in price increases the total expenditure on the commodity, the price elasticity of demand is more than unity (ed > 1).
Q.17. How is elasticity of demand measured by Geometrical Method? Explain.
Ans. According to geometrical method, elasticity of demand at any point on a straight line demand curve can be found with the below mentioned formula
ed = Lower Portion of Demand Curve /Upper Portion of Demand Curve

ed at T= ∞ = ≥(PT/ ∞ ,since any number by zero = ∞)
ed at Point S= >1= (PS/RT,PS ≥ST since S is lying above the midpoint R)
ed at mid- point R= 1(PR/RT,R is the midpoint thus PR/RT = 1)
ed at Point Q= <1=(PQ/QT ,PQ< QT since Q is the below midpoint)
ed at=P=O =(O/PT, since divided by number is equal to zero)
Q.18. Define price elasticity of demand. Discuss the factors affecting price elasticity of demand.
OR
Explain any four factors affecting the price elasticity of demand.
OR
Discuss any four determinants of price elasticity of demand.
Ans. Price elasticity of demand is the degree of responsiveness of demand of a good to a change in the price of the good. Actually it is the ratio of the % change in quantity demanded to the % change in price of a commodity.
Its main influencing factors/determinants can be explained as under:
1. Nature of the good:
i. If the good under consideration is a necessity, then its demand would be inelastic i.e. its demand would be affected only a little whatever be the change in price.
ii. In the case of luxuries, the demand would be elastic, as their demand can be postponed if price changes.
2. Availability of substitutes:
i. If the substitutes are available for the commodity, its demand would be elastic as the consumer can exercise several options.
ii. If the commodity has no substitutes, then its demand would be inelastic.
3. Part of total expenditure spent upon good:
i. If only a small part of income is being spent upon the good, its demand would be inelastic. This won’t affect the demand of the consumer much.
ii. However, if significant part of income is spent upon the good, the demand would be more elastic.
4. Habits:
If the consumer is habitual to the use of any particular commodity, the demand for this commodity would be inelastic and vice versa e.g. demand for alcohol and cigarette would be inelastic for drunkards & smokers.
Q.19. Define indifference curve. Explain why an indifference curve is downward slopping from left to right.
Ans. An indifference Curve is locus of points representing different combinations of the only two goods consumer consumes with each combination having the same utility level. It is downward sloping because to obtain one more unit of a good he must sacrifice some units of the other good so that utility level on each point of the indifference curve remains the same.
Q.20. Using indifference curves approach, explain the conditions of consumer’s equilibrium.
Ans. There are two conditions:
(i) MRS = Ratio of prices
(ii) MRS continuously falls
Explanation:
(i) Let the two goods be X and Y. The first condition for consumer’s equilibrium is that MRS = Px/Py. Now suppose, MRS is greater than Px/Py. It means that the consumer is willing to pay more for X than the price prevailing in the market. As a result the consumer buys more of X. This leads to fall in MRS. MRS continues to fall till it becomes equal to the ratio of prices and the equilibrium is established. (Or, alternatively in terms of when MRS < Px/Py)
(ii) Unless MRS continuously falls, the equilibrium cannot be established.
Q.21. Define Marginal Rate of Substitution. Explain why is an indifference curve convex?
Ans. MRS is the rate at which the consumer is willing to sacrifice units of one good to obtain one more unit of the other good.
It is convex because MRS continuously falls due to the operation of the law of diminishing marginal utility.
Q.22. Define an indifference map. Explain why an indifference curve to the right shows higher utility level.
Ans. The set of indifference curves of a consumer is called indifferent map. IC to the right shows higher utility level because each point on the higher curve shows more goods. More goods, by the assumption of monotonic preferences, mean more utility.
Q.23. What are the properties of indifference curves?
OR
What can you say about the shape of an indifference curve? Explain
Ans. The shape of an indifference curve is essentially the result of its properties. These are given under:
1. IC-curves always slope downward from left to right:
i. Mathematically, any downward or (-) sloped curve always indicates that increase in the quantity of one good is only possible if the quantity of the other good is decreased.
ii. This should be true with the basic assumption of equal satisfaction on same IC-Curve. This is only possible when IC-Curve slopes downward to right or negatively sloped.
iii. Any curve which is positively sloped, horizontally sloped or vertically sloped will be against the basic assumption of equal satisfaction on same IC-curve like.

All the above slopes are just opposite to the definition of IC-curve. So ultimately, our statement is consistent with the basic assumption that IC-curve must slope downwards.
2. Two IC-curves can never intersect each other:
i. This property of IC-curve is based upon the assumption that any IC-curve shows different level of satisfaction and each point on one IC1-curve shows same level of satisfaction.
ii. Here the consumer is indifferent combination on IC2, which is inconsistent and contrary to the definition. Thus two IC-curves can never intersect each other.

3. IC-curves are always convex to the origin:
i. This property of IC-curve is based upon the assumption that IC-curves have a diminishing MRS.
ii. MRS or Marginal rate of substitution is defined as the quantity of good Y that a consumer is ready to sacrifice for a one additional limit of good X.
iv. Thus MRS is diminishing due to rational consumer behaviour of parting with less and less of Y for an additional unit of X. This results in the shape of IC-curve which is always convex to the origin.
MRSXy = ∆Y/∆X
Q.24. State three changes leading to the shift of demand curve of a commodity to the right.
Ans. The three changes leading to the shift of demand curve to the right are:
(i) Increase in income of the consumer (In case of normal good).
(ii) Increase in prices of substitute goods.
(iii) Fall in the prices of complementary goods.
Q.25. A consumer consumes only two goods X and Y and is in equilibrium. Price of X falls. Explain the reaction of the consumer through the Utility Analysis.
Ans. The consumer is in equilibrium when MUx/Px = MUy/Py Given that Px falls, therefore MUx/Px > MUy / Py
Now since, per rupee MU from consumption of X is higher than from Y, the consumer will transfer expenditure from Y to X. The consumer will buy more of X.
Q.26. Given below is the utility schedule of a consumer for commodity X. The price of the commodity is Rs 6 per unit. How many units should the consumer purchase to maximize satisfaction? Give reasons for your answer. (Assume that utility is expressed in utils and 1 utile = Rs 1).
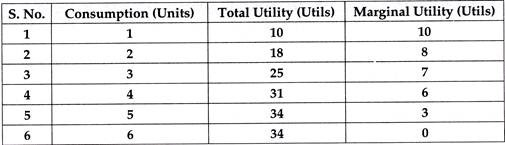
Ans. Consumer will attain equilibrium and hence maximum satisfaction when:
MU of Product X /MU of Money = Price of X
MU of Money MUx = Px. (MU of money)
From the data, MUx = 6 x 1 = 6 (As Px=6)
The 4th unit has a marginal utility of 6 and satisfies the equilibrium condition MUx = Px. (MU of money). Thus consumer should purchase 4 units to get maximum satisfaction, i.e. at that level he will not have the urge to consume any further.
Q.27. Distinguish between:
(a) Individual demand and market demand.
(a) Change in demand and change in quantity demanded.
(a) Individual Demand & Market Demand:
Ans. Demand of an individual means the quantity of a commodity that an individual is willing to buy at a particular price in a given period of time.
i. Suppose Mr. X buys 4 Kg of potatoes at a price of Rs 6 per Kg. per week, it is his individual demand.
ii. Market demand on the other hand is the total demand of a commodity by all the individuals in the market at a particular price in a given period of time.
iii. Suppose at the price of Rs 6 per kg 1,000 tonnes of potatoes are bought daily by all the individuals in Delhi. The market demand for potatoes in Delhi at Rs 6 per Kg. will be 1,000 tonnes per day.
(b) Change in demand & Change in quantity demanded:
i. When there is a rise or fall in demand of a commodity due to factors other than price of the commodity it is called change in demand.
ii. For example, if, because of increase in income of consumers the demand for mobile phones has increased, it will be called change in demand.
iii. The change in demand is of two types (i) increase in demand and (ii) decrease in demand.
iv. On the other hand, whenever quantity demanded changes due to change in price alone of the commodity keeping all other factors constant, it is called change in quantity demanded.
v. The expansion and contraction of demand are the two types of change in quantity demanded.
Q.28. Distinguish between contraction of demand of a commodity and decrease in demand. Use diagram.
Ans. Contraction of Demand:
When demand of a good falls due to rise in its price of the commodity & keeping other factors constant, it is called fall in quantity demanded or contraction of demand.
In figure 1, due to rise in the price of the commodity, there is upward movement along the demand curve and quantity demanded has decreased from OQ to OQ1 when the price rises from OP to OP1.
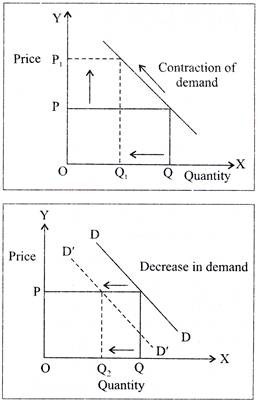
Decrease in demand:
i. When the demand for a commodity falls due to factors other than price of the commodity, it is called decrease in demand. In case of decrease in demand, the demand curve shifts to the left.
ii. In figure 2, DD was the original demand curve which has shifted towards left to D’D’ because of decrease in demand. The quantity demanded has reduced from OQ to OQ2 due to decrease in demand.
Q.29. State the causes of shift in a demand curve.
Ans. The causes of shift in a demand curve are:
(i) Change in the income of the consumers.
(ii) Change in the prices of substitute goods.
(iii) Change in the prices of complementary goods.
(iv) Change in tastes and preferences of the consumer.
Q.30. Explain how rise in income of a consumer affects the demand of a good. Give examples.
Ans. Normal Good Case:
Income increases, demand increases.
Example:
If the consumer demands more of good X after the rise in income, then that good is a normal good for that consumer.
Inferior Good Case:
Income increases, demand decreases.
Example:
If the consumer demands less of good X after the rise in income, that good X is an inferior good for that consumer.
Q.31. Explain the effect of increase in income of buyers of a ‘normal’ commodity on its equilibrium price.
Ans. i. Increase in income increases demand at the given price.
ii. This leads to excess demand.
iii. Leads to competition among buyers. As a result price starts rising.
iv. Rise in price leads to rise in supply and fall in demand.
v. These changes continue till supply and demand become equal at a new equilibrium price.
vi. Equilibrium price rises.
Q.32. How does the equilibrium price of a ‘normal’ commodity change when income of its buyers falls? Explain the chain of effects.
Ans. i. When income falls demand falls.
ii. Supply remaining unchanged, there is excess supply at the given price.
iii. This leads to competition among sellers leading to fall in price.
iv. As a result demand starts rising and supply starts falling.
v. These changes continue till a new equilibrium price is established where demand equals supply.
vi. Equilibrium price falls.
Q. 33. Distinguish between a normal good and an inferior good. Give example in each case.
Ans. A normal good is one whose demand increases when income increases while an inferior good is one whose demand decrease with rise in income. Suppose income of a consumer increases. As a result the consumer reduce consumption of tonned milk and increases consumption of full cream milk. In this case tonned milk is an inferior good for the consumer and full cream milk is a normal good.
Q.34. Distinguish between the following:
(a) Normal good and Inferior Good.
(b) Marginal utility and Total utility.
Ans. (a) Normal Good and Inferior Good
(a) Normal Goods:
When the increase (decrease) in income of the buyer, the demand for the good increases (decreases), the good is called an inferior good.
i. Normal goods are directly related to the income of the consumer.
ii. Their demand rises with the rise in income and falls with a fall in the income of the consumer. They follow law of demand.
Inferior Goods:
When with increase (decrease) in income of the buyer, the demand for the good increases (decreases), the good is called normal good.
i. Inferior goods on the other hand are those goods demand for which falls with the rise in income of the consumer.
ii. For example toned milk.
iii. With the rise in income of the consumer, he will prefer to buy better milk so the demand for toned milk will decrease.
(b) Marginal Utility and Total Utility Marginal Utility:
i. Marginal utility is the change in total utility that a consumer derives from consuming an additional unit of a commodity.
ii. It can be expressed as:
MUx = TUn-TU n-1
Total Utility:
i. Total utility is the aggregate utility that a consumer derives by consuming a given quantity of a commodity.
ii. It can be obtained by adding marginal utilities of various units consumed. It can be expressed as
TU = MU1 + MU2 + MU3………. MUn
i.e., TU = ∑MU
Q.35. Define a budget line. When can it shift to the right?
Ans. A budget line is the locus of points representing different combinations of the two goods which the consumer can buy from his given income and given price in the market.
A budget line is dependent on income of the consumer and the price of the two goods and also assumes these as given. Thus a change in income or price of one good or both the good can lead to shift of budget line.
Q.36. Explain the conditions of Consumer’s Equilibrium with the help of utility analysis.
Ans. The two conditions are:
(1) The ratio of marginal utility to price is same in case of all the goods consumed. Suppose the consumer consumes only two goods X and Y, then
MUx/ Px=MUy/Py
(2) Marginal utility has a tendency to fall as more and more units are consumed
Q.37. Explain the conditions determining how many units of a good the consumer will buy at a given price.
Ans. Given price the consumer compares marginal utility with price. When he finds MU greater than price, he continues to buy more. As he buys more, MU falls. When the falling MU becomes equal to the price, the consumer does not buy more.
If he buys more, MU will become less than the price. So, he buys upto the point where MU = P.
Q .38. Given price of a good, how does a consumers decide as to how much of that good to buy?
Ans. Consumer purchases up to the point where MU = Price. So long as MU > P, he keeps on purchasing. As he makes purchases, MU falls and at a particular quantity of the good MU becomes equal to Price. Consumer purchases up to this point.
Q.39. A consumer consumes only two goods X and Y. State and explain the conditions of consumers equilibrium with the help of utility analysis.
Ans. The two conditions are:
(1) MUX/ Px= MUy/ PY or MUx /MUy = PX/PY
Explanation:
If MUx/Px > MUy/ Py, the consumer is not in equilibrium because he can raise his total utility by buying less of Y and more of X.
MUx / Px if Mux / Py the consumer is not m equilibrium as he can raise his TU by buying less of X and more of Y.
(2) MU falls as consumption increases.
If MU does not fall as consumption increases the consumer will end up buying only one good which is unrealistic or consumer will never reach the equilibrium position.
Q.40. State three causes each, for a rightward shift and a leftward shift of demand curve.
Ans. Three causes of rightward shift (increase in demand) are:
(i) Increase in the income of the consumers (in case of a normal good)
(ii) Increase in the prices of substitute goods.
(iii) Favourable change in tastes and preferences.
Three causes of leftward shift (decrease in demand) are:
(i) Decrease in the prices of substitute goods.
(ii) Increase in the prices of complementary goods.
(iii) Unfavorable change in tastes and preferences.
Q.41. Explain any two factors that affect the price elasticity of demand. Give suitable examples.
Ans. (i) Number of Substitutes:
Where the number of close substitutes of a good is more, the price elasticity of that good, is higher. Because, in case of a price change a consumer can easily shift from one substitute to another.
For example, rise in the price of Coke encourages buyers to buy Pepsi.
(ii) Income Level:
For higher income level groups, the price elasticity for any commodity is usually less. Because, rich people are generally not influenced much by changes in the prices of goods.
For example, increase in price of petrol usually do not affect the consumption of petrol by rich people.
Q.42.
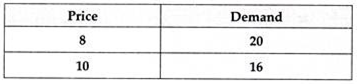
Find elasticity of demand with total outlay method.
Ans.
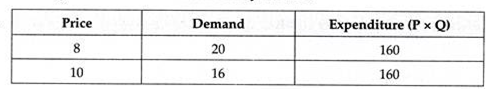
With rise in price, there is no change in total expenditure, therefore as per total outlay method ED=l.
Q.43. How does the budget line change if a consumers ‘s income increases from Rs 20 to Rs 40 but the prices remain unchanged?
Ans. i. If the income of the consumer increases from Rs 20 to RS 40, he will be in a position to buy more of both the goods (X and Y).
ii. The original budget line (AB) will shift towards right.
iii. The new budget line A’B’ will be parallel to the original budget line AB as shown in the graph below:
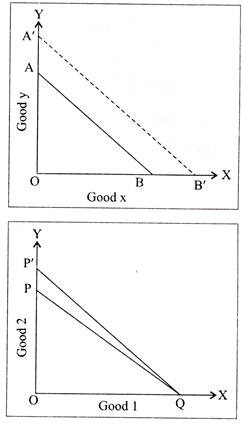
Q.44. How does the budget line change if the price of good 2 decreases by a rupee but the price of good 1 and the consumers income remain unchanged?
Ans. i. In case price of good 2 decreases, the consumer will obviously be in a position to buy more of good 2.
ii. Point P of original budget line PQ will then move upward to P’ so that P’Q will be the new budget line as shown in the figure.
Q.45. The price elasticity of demand for a good is – 0.4. If its price increases by 5 percent, by what percentage will its demand fall? Calculate.
Ans. Ep = Percentage change in demand/ Percentage change in price
(-)0.4 = Percentage change in demand/5
Percentage change in demand =-0.4 x 5 =-2
i.e., demand falls by 2 percentage
(No marks if only the final is given)
Q.46. Consider the demand for a good. At price of Rs 4, the demand for the good is 25 units. Suppose price of the good increases to Rs 5, and as a result, the demand for the good falls to 20 units. Calculate the price elasticity.
Ans. Ed = ΔP/ ΔQ. P/Q
P = Rs 4
Q = 25 unit
∆P =(Rs 5 -Rs 4) RS 1
∆Q= (25- 20) = 5 unit
Putting the value in the from
Ed= 4/25 x 5/1= 0.8
Q.47. Consider the demand curve Q = 10 – 3p. What is the elasticity at price 5/3?
Ans. Q= 10 -3P
P= 5/3 is given
Q= 10 – 3 x 5/3
Q= 5
Different Q with respect to P
∆Q/∆P = -3
Ed = (-) ∆Q/∆P x P/Q
= (-) 3 x (5/3)/5
= (-) 3x 5/3 x 1/5
Ed= (-) 1