Read this article to learn about the top twenty-five frequently asked questions on Producer Behaviour and Supply.
Q.1. Explain the Law of variable Proportions with the help of total product and marginal product schedule.
ADVERTISEMENTS:
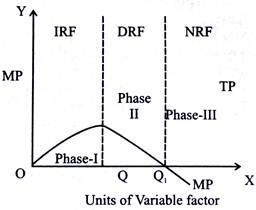
Ans. Phase-I:
MP increases and TP increases at increasing rate i.e. up to A on TP curve (up to K on MP curve)
Phase-II:
MP decreases but is positive and TP increases at decreasing rate i.e. up to B on TP curve (up to L on MP curve)
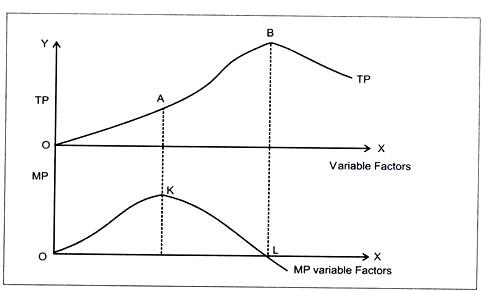
Phase-III:
MP decrease and is negative and TP falls i.e. after B on TP curve (after L on MP curve)
Q.2. Explain the law of variable proportion. Also state the reasons behind the law.
Ans. This is regarded as the most popular law of production in short run. As we know in short time period, the production can be increased by use of variable factor only when other factors would remain constant.
ADVERTISEMENTS:
i. As per the law of variable proportion, as we use more and more units of a variable factor keeping other variable factors constant; initially total product (TP) increases at an increasing rate then total product (TP) increases at a diminishing rate and ultimately it falls.
Assumptions:
1. The technology of production remains constant.
2. Some factors are variable whereas some are fixed.
3. Units of variable factors are equally efficient.
4. No factor of production has perfect substitutes.
5. Factor ratio is changeable.
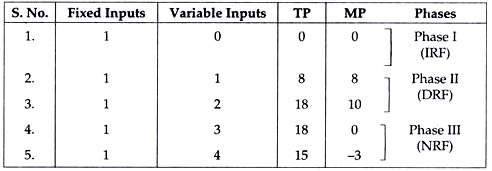
The law of variable proportion can be classified in three phases. Furthermore, this can be understood by the relationship between TP and MP. This can be shown by the schedule given as under.
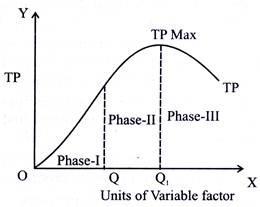
 The law can be shown by a diagram below.
The schedule and the diagram show that the law has three phases:
ADVERTISEMENTS:
i. In the first phase i.e., the stage of increasing returns to factor the TP increases at an increasing rate and MP also rises. This is due to under use of fixed factor and specialisation of labour.
ii. In the second phase i.e., the stage of decreasing returns to factor the TP increases at a diminishing rate and MP falls but remains positive. This is due to optimal use of fixed factor and lack of perfect substitutability of inputs.
iii. In the third Phase i.e., stage of negative returns to factor, the TP falls and MP becomes negative.
ADVERTISEMENTS:
The reasons for the law are:
1. Optimum use of factors.
2. Lack of perfect substitutability between factors.
3. Over use of factors.
ADVERTISEMENTS:
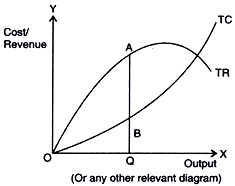
Q.3. What is meant by producer’s equilibrium? Explain the conditions of producer’s equilibrium through the ‘total revenue and total cost approach. Use diagram.
Ans. Producer’s equilibrium refers to that level of output at which a producer gets maximum profits.
Conditions:
1. TR-TC should be maximum because TR-TC equal profits. This condition is satisfied where the vertical distance between the TR curve and the TC curve is maximum (i.e. AB)
ADVERTISEMENTS:
2. Profits falls when one more unit of output is produced beyond the output level where TR-TC-is maximum. Or addition to total revenue is less than addition to total cost as more output is produced.
Q.4. What is producer’s equilibrium? Explain the conditions of producer’s equilibrium through the ‘marginal cost and marginal revenue’ approach. Use diagram.
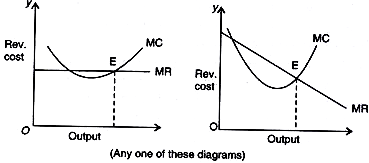
Ans. Producer’s equilibrium refers to that price and output combination which brings the producer maximum profit.
Equilibrium Conditions (Statements)
ADVERTISEMENTS:
(1) MC = MR at point E.
(2) MC > MR after equilibrium i.e. after point E
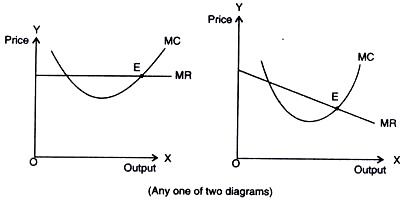
Equilibrium Conditions (explanation):
So long as MR is greater than MC, the producer continues to produce because every new unit produced adds to profits. As he continues to produce, at some level of output MR becomes equal to MC. This maximizes profits.
After MC = MR level, if MC is greater than MR, every new unit produced is sold at a loss. So, he will not produce more units.
ADVERTISEMENTS:
Q.5. At which point does the SMC curve cut the SAC curve? Give reason in support of your answer.
Ans.
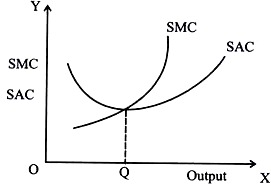
(i) Both AC and MC are derived from TC
AC = TC/Q
And
ADVERTISEMENTS:
MC= ∆TC/∆Q
(ii) Both AC and MC are U-shaped.
(iii) When AC is falling, MC is below it. (OR) MC < AC
(iv) When AC is rising, MC is above it. (OR) MC > AC
(v) When AC is minimum, MC = AC.
Q.6. Explain the conditions of a producer’s equilibrium in terms of marginal cost and marginal revenue. Use diagram.
OR
Explain the conditions of producer’s equilibrium in terms of marginal cost and marginal revenue. Use a schedule.
Ans. There are two conditions of producer’s equilibrium:
(i) MC = MR
(ii) MC is greater than MR after equilibrium:
The condition are fulfilled at point E in the diagram
Explanation:
(i) So long as MC is less than MR, it is profitable for the producer to go on producing more because it adds to its profits. He stops producing more when MC becomes equal to MR.
(ii) When MC is greater than MR after equilibrium it means producing more will lead to decline in profits.
Q.7. Market for a good is in equilibrium. There is simultaneous “decrease” both in demand and supply but there is no change in market price. Explain with the help of a schedule how it is possible.
Ans. After simultaneous decrease
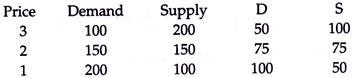
The market is in equilibrium when price is Rs 2 per unit because at this price demand equals supply. For price to remain unchanged after ‘decreases’, the decrease in both must be by the same percentage. In the above table there is 50 percent decrease both in demand and supply. Therefore new equilibrium is also at a price of Rs 2 per unit. (No diagram required)
Q.8. Market for a good is in equilibrium. Explain the chain of reactions in the market if the price is (i) higher than equilibrium price and (ii) lower than equilibrium price.
Ans. (i) When price is higher than equilibrium price:
a. There is excess supply and producers are not in a position to sell all they want to sell at the given price.
b. This leads to competition between producers.
c. Competition between producers leads to lowering of price.
d. Lowering of price raises demand which reduces supply. This continues till demand is equal to supply again at the original equilibrium.
(ii) When price is lower than the equilibrium price:
a. There is excess demand and consumers are not in a position to buy all they want to buy at the given price. This leads to competition between consumers.
b. Competition leads to rise in price.
c. Rise in price reduces demand while raises supply. This continues till demand is equal to supply again at the original equilibrium. (No diagram required).
Q.9. Market for a good is in equilibrium. There is ‘increase’ in supply of the good. Explain the chain of effects of this change. Use diagram.
Ans.
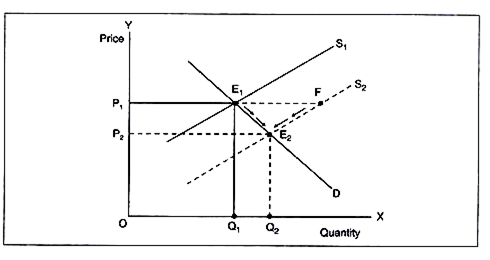
a. ‘Increase’ in supply shifts the supply curve from S1 to S2 to the right leading to excess supply E1F at the given price OP1.
b. Since the firms will not be able to sell all that they want to sell, there will be competition among sellers leading to fall in price.
c. As price falls, demand starts rising (along D) and supply starts falling (along S2) as shown by arrows in the diagram.
d. These changes continue till D = S at a new equilibrium at E2.
e. The quantity rises to OQ2 but price falls to OP2.
Q.10. From the following schedule find out the level of output at which the producer is in equilibrium, using marginal cost and marginal revenue approach. Give reasons for your answer.
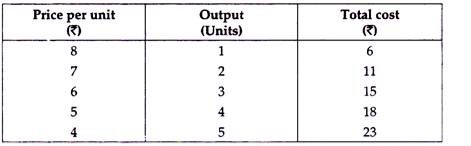
Ans.
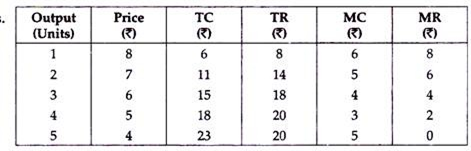
3 units will be produced because at this level of output MC = MR and after this level of output MC > MR.
Q.11. Distinguish between fixed and variable costs.
Ans. Difference between fixed and variable costs is as follows:

Q.12. Using a diagram show the relationship between AC and MC.
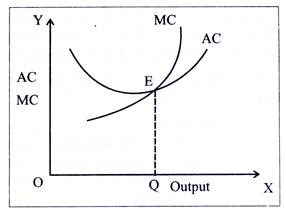
Ans. a. The relationship between AC and MC is as under:
(i) So long as MC is less than AC, AC falls.
(ii) When AC = MC, AC is minimum.
(iii) When MC is greater than AC, AC starts rising.
b. In the diagram MC is below AC (MC<AC) till point E, thus AC is falling till point E. AC=MC at point E where AC is minimum or MC is intersecting AC curve at its lowest point from below. After point E, MC is greater than AC so that AC also starts increasing.
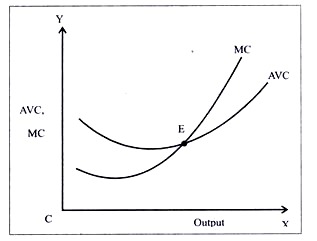
Q.13. Show the relationship between AVC and MC curve.
Ans. a. MC has the same relationship with AVC as it has with AC i.e.
(i) When MC < AVC, AVC falls.
(ii) When MC = AVC, AVC is the minimum.
(iii) When MC > AVC, AVC starts rising.
b. In the diagram AVC is falling till point E when MC < AVC. At point E where AVC is minimum AVC = MC and after E, AVC is also rising since MC > AVC.
Q.14. Show the relationship between AC and AVC using diagram. Also show how AC is derived from AVC?
Ans. a. AC can be obtained by summation of AFC and AVC. The shape of AFC is rectangular hyperbola and AVC is U-shaped. By adding AFC and AVC, another curve is derived which is called AC.
b. The relationship between AVC and AC is as under
(i) Both AC and AVC are U-shaped.
(ii) AC is the sum of AVC and AFC.
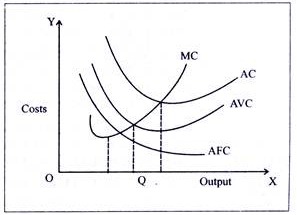
(iii) The vertical distance between the two curves AVC & AC keeps on decreasing but they never meet since AFC is never zero.
(iv) Both AC and AVC have the same relationship with MC i.e. they fall when MC is less than them. They are minimum when MC is equal to them and they start increasing when MC is greater than them.
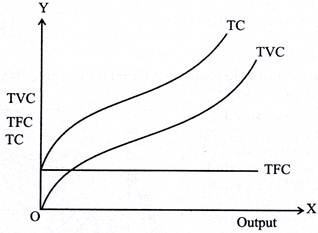
Q.15. What are the total fixed cost, total variable cost and total cost of a firm? How are they related?
Ans. Total costs (TC):
i. This refers to the sum total of expenditure incurred upon a given level of output. This includes the expenses upon fixed factors of production and variable factors of production as well.
Total fixed cost (TFC):
i. This refers to the sum total of expenditure incurred upon fixed factors of production.
ii. For example salaries to permanent employees and rent for building etc.
Total variable cost (TVC):
i. This refers to the sum total of expenditure incurred upon variable factors of production.
ii. For example daily wages to labourers, expenses upon raw material etc.
Thus symbolically
TC = TFC +TVC
Thus the change in TC is brought only by the change in TVC. Due to this TC and TVC curves are parallel to each other and TC starts above the origin.
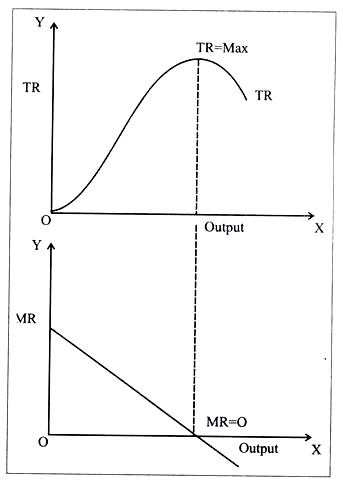
Q.16. What is the relationship between TR and MR? Explain with diagrams.
Ans. The relationship between TR and MR is as under:
(i) The extent to which TR rises, when one additional unit of a commodity is sold, is known as MR for that commodity.
(ii) TR keeps rising as long as MR is positive.
(iii) TR reaches its maximum when MR is drops to zero.
(iv) TR starts falling as soon as MR becomes negative.
(v) In case of MR being constant, TR also increases at constant rate.
Q.17. Explain briefly any three determinants of supply of a commodity.
Ans. The three determinants of supply are:
(i) State of technology:
With an improvement in the state of technology the production will increase. The cost of production will be reduced.
(ii) Prices of Related Goods:
A rise in the price of related goods (substitute good) makes them more attractive for its producer. Thus the supply of the commodity will increase if price of the substitute goods will fall.
(iii) Prices of inputs:
Prices of inputs affect the cost of production of the commodity. If cost of inputs rises, supply will decrease and a reduction in cost of inputs will increase the supply of the commodity.
Q. 18. Give three causes of a rightward shift of supply curve.
Ans. A rightward shift in supply curve is caused by:
(i) Decrease in prices of inputs:
If prices of inputs fall, it will bring down the marginal cost curve and the supply curve will rise and shift towards right?
(ii) Advancement in technique of production:
The advancement of technology will reduce the cost of production, thus the supply of the commodity will increase and supply curve will shift to the right.
(iii) Decrease in prices of related goods:
It price of related goods (substitute goods) goes down, their production will become less profitable and the supply of commodity whose price has not decreased will increase Thus price of substitute goods holds inverse relation with quantity supplied of a commodity.
Q.19. Market for a good is in equilibrium. There is simultaneous “increase” both in demand and supply of the good. Explain its effect on market price.
Ans. There are three possibilities:
1. If the relative (percentage) increase in demand is greater than the increase in supply, price will rise.
The price will rise because of excess demand in the market.
2. If the relative (percentage) increase in demand is less than the increase in supply, price will fall.
The price will fall because of excess supply in market.
3. If the relative (percentage) increase in demand is equal to the increase in supply, price will remain unchanged.
The price will remain unchanged because there is neither excess demand nor excess supply in the market.
Q.20. Market for a good is in equilibrium. There is simultaneous “decrease” both in demand and supply of the good. Explain its effect on market price.
Ans. There are three possibilities:
1. If the relative (percentage) decrease in demand is greater than the decrease in supply, price will fall.
The price will fall because of excess supply in the market.
2. If the relative (percentage) decrease in demand is less than the decrease in supply price will rise.
The price will rise because of excess demand in the market.
3. If the relative (percentage) decrease in demand is equal to the decrease in supply, price will remain unchanged.
The price will remain unchanged because there is neither excess demand nor excess supply in the market.
Q.21. Give three causes that lead to a decrease in the supply of a commodity. How does it differ from contraction of supply?
Ans. The three causes that may lead to decrease in the supply of a commodity are:
(i) Increase in the prices of related goods:
a. If prices of related goods (substitute goods) increase, their production will become more profitable and producer will produce more of those goods.
b. Thus the supply of the commodity whose price has not increased will decrease.
(ii) Increase in the prices of inputs:
If prices of inputs increase it will lead to an increase in the cost of production of the commodity and the supply of the commodity will decrease.
(iii) Rise in excise tax:
i. A change in government policy, e.g., if heavy excise duty is imposed on the commodity, will result in decrease in supply as producers will be discouraged to produce those goods.
ii. Decrease in supply is due to factors other than price of the commodity whereas contraction of supply curve is downward movement along the supply curve which occurs or only because of the price of the commodity keeping other factors constant.
Q.22. When is the supply of a commodity said to be (i) elastic, (ii) inelastic and (iii) unitary elastic.
Ans. (i) Elastic:
If percentage change in quantity supplied is more than the percentage change in price of the commodity, supply will be called elastic.
(ii) Inelastic:
If percentage change in quantity supplied is less than the percentage change in price of the commodity, it is known as inelastic supply.
(iii) Unitary elastic:
If percentage change in quantity supplied is equal to percentage change in price, it is a case of unitary elastic supply.
Q.23. Explain the distinction between “change in quantity supplied” and “change in supply”. Use diagram.
Ans. Change in Quantity supplied refers to change in supply due to own price of the good only. It means movement along the same supply curve. It is called extension when supply rises (from D to E) and contraction when supply fall (from F to E).
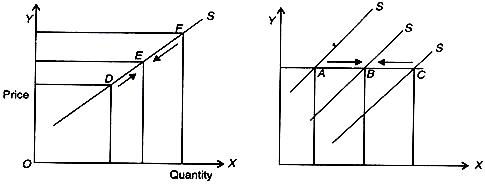
Change in supply refers to change in supply due to factor other than the own price of the good like change in prices of inputs etc. This leads to shift of supply curve. It is called ‘increase’ when supply rises (from A to B) and ‘decrease’ when supply falls (from C to B)
Q.24. How is equilibrium price of a commodity determined? Explain with the help of a demand and supply schedule.
Ans.

Equilibrium price is the price at which demand and supply of a commodity are equal. In the schedule equilibrium price is Rs 3/- at which both demand and supply of the commodity are equal to 300 units. If the price of this commodity is Rs 4/- per unit than at this price, supply is in excess to demand and there will be competition among sellers due to which price will fall up to Rs 3/-.
If the price is Rs 2 then due to excess demand, there will be competition among buyers due to which price will rise up to Rs 3/-. Therefore equilibrium price of the commodity is Rs 3/-, where demand equals supply.
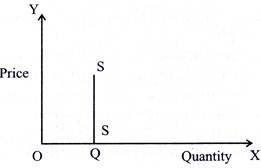
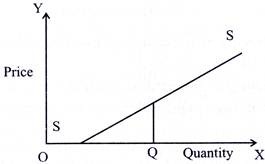
Q.25. Define price elasticity of supply. Draw the supply curves showing price elasticity of supply (i) equal to one (ii) greater than one (iii) less than one and (iv) equal to zero.
Ans. The degree of responsiveness of change in quantity supplied of a commodity due to a percentage change in its price, is called price elasticity of supply.
It is measured by the following formula:
![]()
(i) Supply curve with unitary elasticity (Eg = 1) The elasticity of supply of a straight line supply curve passing through origin is equal to one, irrespective of the angle it makes with X-axis.
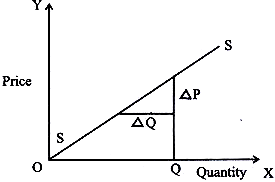
(ii) Elasticity of supply greater than one (Es > 1). A straight line supply curve starting from Y-axis has an elasticity greater than one).
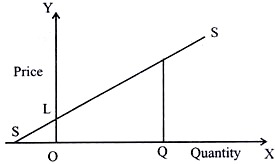
(iii) Elasticity of supply less than one (Es < 1). A straight line supply curve starting from X-axis has an elasticity of supply less than one.
(iv) Elasticity of supply equal to Zero: (A straight line supply curve parallel to Y-axis has an elasticity equal to zero.