
Read this article to learn about the sixteen frequently asked questions on the forms of market and prices determination.
Q.1. Briefly discuss the main features of monopolistic competition.
Ans. The main features of monopolistic competition are:
(i) Large Number of Buyers and Sellers:
ADVERTISEMENTS:
There are large number of buyers and sellers here.
(ii) Product Differentiation:
The products of different firms are close substitute of each other. Each firm distinguishes its product from others by using a brand name. The products are different in shapes, colours, packing, quality etc.
(iii) Freedom of entry and exit:
ADVERTISEMENTS:
In this type of market, there is no restriction on entry or exit of firms.
(iv) Selling Costs:
Each firm tries to promote its sales through advertising, thus selling costs are very high.
(v) High Transportation Costs:
ADVERTISEMENTS:
The transportation costs for transporting the products from one place to another are very high under monopolistic competition.
(vi) Non Price Competition:
Each firm competes with others by improving quality of its product or through sales promotion and not through price changes. There is thus a non-price competition among the firms.
(vii) Imperfect Knowledge:
Buyers and sellers do not have perfect or complete knowledge of market conditions.
Q.2. Giving reasons, state whether the following statements are true or false:
Ans. (i) A monopolist can sell any quantity he likes at a price.
(ii) When equilibrium price of a good is less than its market price, there will be competition among the sellers.
(i) False a monopolist can sell more quantity only by lowering the price because the monopolist controls only the supply and not the demand.
ADVERTISEMENTS:
(ii) True, because when the prevailing market price is higher than the equilibrium price there will be excess supply, and since the sellers will not be able to sell all they want to sell, there will be competition among sellers.
Q.3. Briefly describe the causes that lead to monopoly.
Ans. Causes that lead to monopoly are:
(i) Patent Rights:
ADVERTISEMENTS:
A firm can apply for patents rights and can have exclusive right to a production process or technology. No other firm can use the technology for which a patent right exists.
(ii) Govt. Licence:
A monopoly market will arise when Govt., gives the licence to just one firm i.e. an exclusive legal right to produce a product or generate a particular service in a particular area.
(iii) Cartels:
ADVERTISEMENTS:
Sometimes a large number of the firms openly agree to work together. Such groups are known as cartels. OPEC is an example of a cartel. In a cartel, an individual firm maintains its individuality inspite of being part of a group too.
(iv) Control of Resources:
A firm can have monopoly by gaining control over the resources necessary for the production, if the resources have no substitutes.
(v) Economies of Scale:
Sometimes firms are in a position to control the market because of economies of scale enjoyed by them. The competitors find it difficult to sell their goods at a price as low as that of the existing firm.
(vi) Legal Barriers:
ADVERTISEMENTS:
Monopolies are also created by state or by law e.g. Railways.
Q.4. State the features of perfect competition.
Ans. The features of perfect competition are as under:
(i) Large number of buyers and sellers:
The number of buyers is very large and a single seller or buyer is not in a position to influence the price.
(ii) Homogenous Product:
ADVERTISEMENTS:
Product sold in a market under perfect competition is homogeneous, i.e.. the units sold are identical in each and every respect and are perfect substitute of each other.
(iii) Free entry and exit of firms:
There is no restriction on entry and exit of new firms. Thus in the long run, every firm under perfect competition earns normal profits only.
(iv) Perfect knowledge:
The buyers and sellers have perfect knowledge of the market conditions under perfect competition.
(v) Perfect mobility of factors of production:
ADVERTISEMENTS:
There is perfect mobility of factors of production which means factors of production can easily move from one firm to other or even from one industry to another.
(vi) Absence of transportation cost:
It is assumed that all goods are produced locally and transportation costs are zero.
(vii) Absence of selling cost:
There are no advertisement or sales promotional activities under perfect competition. Selling costs are thus zero.
ADVERTISEMENTS:
Q.5. Distinguish between perfect competition and monopolistic competition?
Ans. The distinction between perfect competition and monopolistic competition can be put as under:

Q.6. Distinguish between collusive and non-collusive oligopoly. Explain how the oligopoly firms are interdependent in taking price and output decisions.
Ans. Collusive oligopoly is one in which the firms cooperate with each other in deciding price and output whereas, non-collusive oligopoly in one in which the firms compete with each other.
The firms are interdependent because each firm takes in to consideration the likely reactions of its rival firms when deciding its output and price policy.
It makes a firm dependent on other firms. The firm may have to reconsider the change in the light of the likely reactions
Q.7. Distinguish between ‘non-collusive’ and ‘collusive’ oligopoly. Explain the following feature of oligopoly:
Ans. (i) Few firms
(ii) Non-price competition
Collusive Oligopoly is one in which the firms cooperate with each other in deciding price and output, while Non collusive Oligopoly is one in which firms compete with each other.
(i) Few firms:
The implication is that the number of firms is manageable enough to make a guess of the likely reactions of rival by a firm.
(ii) Non price competition:
The firms are afraid of competing through lowering the price because it may start price war. Therefore they compete through the non- price factors like advertising, after sales service, etc.
Q.8. Equilibrium price may or may not change with rightward shifts in both demand and supply curve. Explain with the help of diagrams.
Or
What will be the effect on equilibrium price if demand and supply both increase simultaneously.
Ans. There can be three possibilities when demand and supply both increase simultaneously.
(i) Demand and supply both increase in same proportion.
(ii) Increase in demand is more than increase in supply.
(iii) Increase in demand is less than increase in supply.
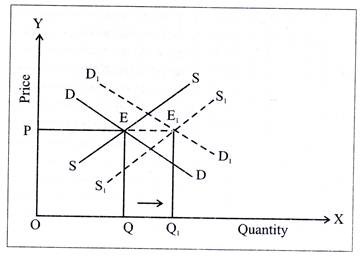
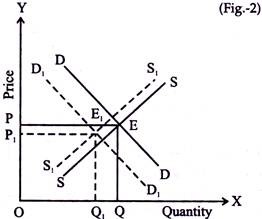
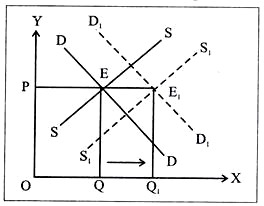
(i) When demand and supply both increase in the same proportion
There will be no change in equilibrium price when demand and supply both increase in the same proportion. In the above diagram DD and SS are demand and supply curves intersecting at E. The equilibrium price is OP and OQ is the equilibrium quantity. After increase in both demand and supply in same proportion, the two curves shift to D1D1 and S1S1 respectively. The equilibrium price OP obviously remains unchanged.
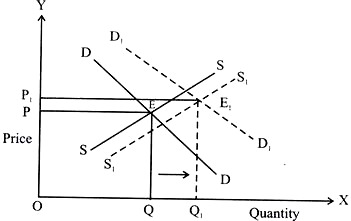
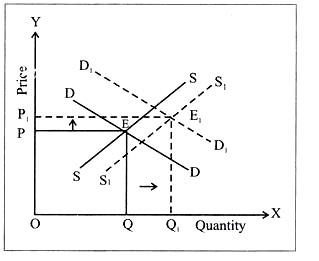
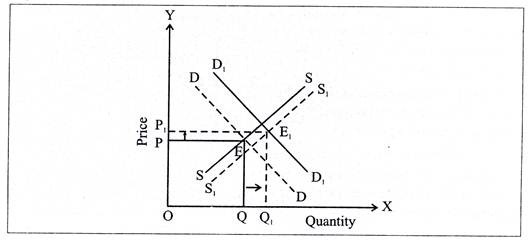
(ii) When increase in demand is more than increase in supply:
When increase in demand is more than increase in supply the equilibrium price will increase as shown in the diagram below.
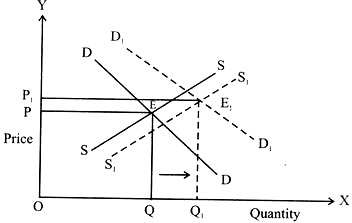
In the above diagram, DD and SS are demand and supply curve and the equilibrium price is OP. D1D1 and S1S1 are the new demand and supply curves when increase in demand is more than increase in supply. OP1 is the new equilibrium price.
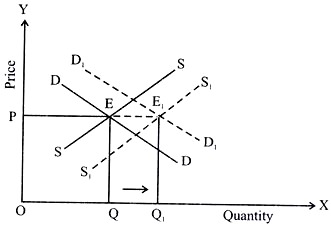
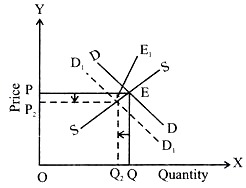
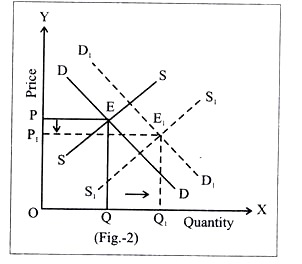
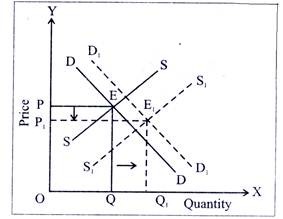
(iii) When increase in demand is less than increase in supply:
If demand and supply both increase and increase in demand is less than increase in supply, the equilibrium price will decrease as shown in the diagram below:
In the above diagram DD and SS are demand and supply curves. After increase both the curves shift to right and become D1D1 and S1S1 When increase in demand is less than increase in supply, OP1 is the new equilibrium price which is less than the original equilibrium price OP.
Thus if demand & supply both increase, depending upon the extent of increase in both of them the equilibrium price can increase, decrease or remain unchanged.
Q.9. Define equilibrium price. Explain the three situations under which equilibrium price will rise.
Ans. Price which is determined by intersection of forces of demand and supply is called Equilibrium price.
The three situations when equilibrium price will rise are:
(i) A rise in demand, supply remains constant.
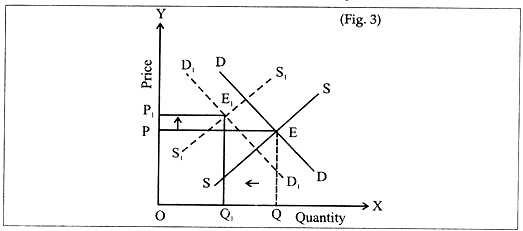
(ii) A fall in supply, demand remains constant.
(iii) When rise in demand is more than rise in supply.
(i) A Rise in Demand:
An increase in demand, when supply remains constant will increase the equilibrium price as shown in the diagram below: In the above diagram DD and SS are demand and supply curves. With increase in demand, DD shifts to the right to D1D1. As a result the equilibrium price increases from OP to OP1.
(ii) A Fall in Supply:
The equilibrium price will also rise if demand remains constant and supply decreases.

In the above diagram D1D1 and S1S1 are demand and supply curves. If supply decreases the supply cure SS will shift to the left to S1S1. As a result the equilibrium price will increase from OP to OP1.
(iii) When rise in demand is more than rise in supply:
The equilibrium price will also rise if demand and supply both increase but increase in demand is more than increase in supply as shown in the figure below:
In the above diagram DD and SS are demand and supply curves intersecting at E and OP is the equilibrium price. With the rise in both demand and supply, the respective curves have shifted to D1D1 and S1S1 and the equilibrium price thus rises from OP to OP1.
Q.10. How are equilibrium price and quantity affected when incomes of the consumers.
Ans. (a) Increase
(b) Decrease
The income of the consumer affects the demand of a commodity and thus affects the equilibrium price and quantity of a commodity.
The effect of change in income on equilibrium price and quantity of a commodity will be as under
Increase in Income:
It will increase the demand for a normal good and the demand curve will shift to the right. The equilibrium price and quantity both will increase.
Decrease in Income:
In this case the demand for a normal good will decrease. It will cause a leftward shift of demand curve. The equilibrium price and quantity both will decrease.

The above diagram shows that with the rise in income the demand curve DD has shifted to the right to D1D1 and the equilibrium price and quantity have increased by PP1 and QQ1 respectively.
(b) Decrease in income:
Similarly with the fall in income of the consumer the demand curve DD has shifted to the left to D1D1 and equilibrium price and quantity have decreased to OP2 and OQ2 respectively.
Q.11. Market for a good is in equilibrium. There is an ‘increase’ in demand for this good. Explain the chain of effects of this change Use diagram.
Ans.
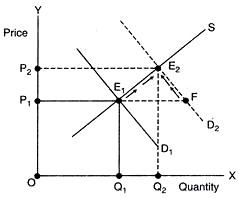
‘Increase’ in demand shifts the demand curve from D1 to D2 to the right leading to excess demand E1 F at the given price OP1.
i. Since the consumers will not be able to buy all they want to buy at this price, there will be competition among buyers leading rise in price.
ii. As price rises, demand starts falling (along D2) and supply starts rising (along S) as shows by arrows in the diagram.
iii. This change continue till D and SS are equals at E2.
iv. The quantity rises to OQ2 and price to OP2.
Q. 12. Explain through a diagram the effect of a rightward shift of both the demand and supply curves on equilibrium price and quantity.
Ans. When demand and supply curves of a commodity shift to the right or when both increase, the equilibrium quantity of the commodity will also increase. The equilibrium price however may or may not be affected.
Following three possibilities exist:
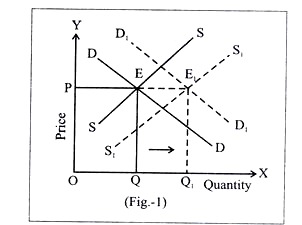
(i) When demand and supply of a commodity both increase in the same proportion, there will be no effect on the equilibrium price, it will remain same as shown in the figure-1, but equilibrium quantity will increase. This is shown below i.e. from OQ to OQ1.
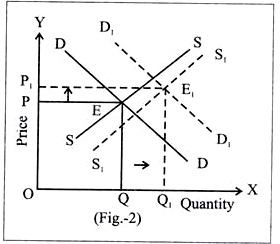
(ii) When increase in demand is more than increase in supply, equilibrium price will increase as shown in the figure-2. It will result in increase of both i.e., equilibrium quantity & equilibrium price. Yet the increase in the equilibrium price will be less than the increase in equilibrium quantity. This is reflected by PP1 to QQ2 in the diagram.
(iii) When increase in demand is less than the increase in supply, the equilibrium price will fall as shown in the figure-3. This will result in the fall of equilibrium price from OP to OP1& increase in equilibrium quantity from OQ to OQ1. This will benefit the consumer as not only the equilibrium price has decreased but equilibrium quantity has increased.
Q.13. How are the equilibrium price and quantity affected when:
(i) Both demand and supply curves shift in the same direction?
(ii) Demand and supply curves shift in the opposite direction?
Ans. (i) When shift of demand and supply is in same direction:
The shift of demand and supply curves can be in either of following two directions:
(I) Leftward
(II) Rightward
(I) Leftward shift of demand and supply curves:
In this case, the equilibrium quantity will fall. The equilibrium price may or may not be affected.
The three possibilities of impact on equilibrium price are as under:
(a) When decrease in demand and decrease in supply are equal, equilibrium price will not change.
It will remain the same as shown in the figure:
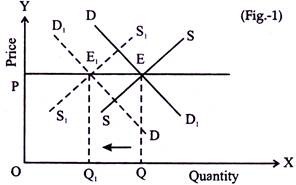
With equal decrease in demand and supply, equilibrium price has not been affected; only the equilibrium quantity is reduced by OQ1.
(b) When decrease in demand is more than the decrease in supply:
The decrease in demand in the figure-2 is more than the decrease in supply, the equilibrium price thus has decreased from OP to OP1. The equilibrium quantity has also decreased from OQ to OQ1.
(c) When decrease in demand is less than the decrease in supply, the equilibrium price will rise and equilibrium quantity will to OQ1
(II) Rightward shift of demand and supply curve:
In cases of increases in both demand and supply, the equilibrium quantity will increase. The equilibrium price may or may not be affected.
The equilibrium price can be affected in the following three ways:
(a) If demand and supply both increase in the same proportion the equilibrium price will remain unchanged as shown in the figure below but equilibrium quantity will increase to OQ1.
(b) When increase in demand is more than the increase in supply, the equilibrium price will rise as shown in the figure below
(c) When increase in demand is less than the increase in supply, the equilibrium price will fall as shown in the diagram below but equilibrium quantity will increase to OQ1
(ii) When demand and supply curves shift in the opposite direction:
There can be two cases:
(a) When demand increases and supply decreases
(b) When demand decreases and supply increases
(i) When demand increases and supply decreases: The equilibrium price will increase as increase in demand and decrease in supply both lead to increase in the equilibrium price of the commodity. The equilibrium quantity may or may not be affected.
Once again, there can be following three scenarios:
(a) When increase in demand is more than the decrease in supply, the equilibrium quantity will increase as shown in figure-1.

Equilibrium price and quantity both have increased by PP1 and QQ1 respectively. The increase in price will be more than the increase in equilibrium quantity here.
(b) When increase in demand is less than the decrease in supply, the equilibrium quantity will decrease as shown in Figure-2.

The equilibrium price has increased from OP to OP1 but the quantity has decreased from OQ to OQ1.
(c) When increase in demand is equal to decrease in supply, the equilibrium quantity will remain the same as shown in Fig.3.

The equilibrium price has increased from OP to OP1 but quantity remains unaffected.
(b) When demand decreases and supply increases
The equilibrium price will fall as decrease in demand and increase in supply both lead to a fall in the price of the commodity. The equilibrium quantity may or may not change. There can be three cases again:
(1) When decrease in demand is more than increase in supply, the equilibrium price and quantity both will fall as shown in the fig.-4.

The equilibrium price and quantity both have decreased by PP1 and QQ1 respectively.
(2) When decrease in demand is equal the increase in supply, only the equilibrium price will fall but equilibrium quantity will remain same as shown in fig.-5. Equilibrium quantity remains the same; only equilibrium price falls.

(3) When decrease in demand is less than the increase in supply, the equilibrium quantity will rise but equilibrium price will fall as shown in fig. -6
Equilibrium price falls from OP to OP1 but equilibrium quantity increases from OQ to OQ1. 
Q.14. What would be the shape of the demand curve so that the total revenue is:
(a) Positively sloped straight line passing through the origin.
(b) Horizontal line.
Ans. (a) When TR curve is a positively sloped straight line passing through origin, the demand curve will be horizontal line parallel to X-axis as shown in the figures below:
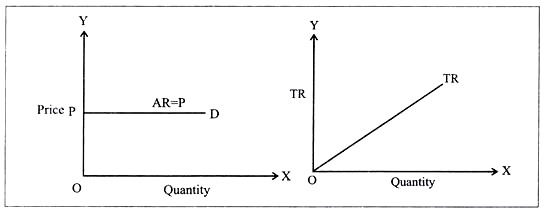
If TR is a positively sloped line, price at each level of output will be constant, so that the price line will be parallel to X-axis. And demand curve being also the price line, it will also be parallel to X-axis.
(b) When TR is a horizontal line and the demand curve will be a rectangular hyperbola as shown in the figures below
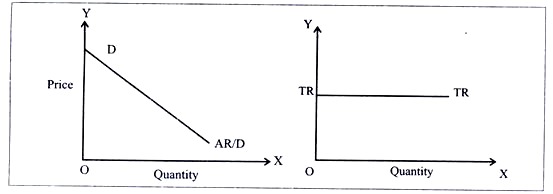
Now here, inspite of increase in output, TR is same implying that price keeps coming down for each level of output. Hence, the demand curve is rectangular hyperbola.
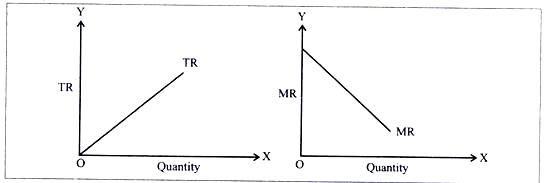
Q.15. Comment upon the shape of the MR curve in case the TR curve is a (i) positively sloped straight line, (ii) horizontal straight line.
Ans. (i) MR will be falling but is positive since increasing TR means that quantity demanded is rising in a greater proportion than the proportion in which price is falling.
(iii) When TR is a horizontal straight line, MR will be zero. A horizontal TR means there is no increase in TR when an additional unit is sold or the proportion
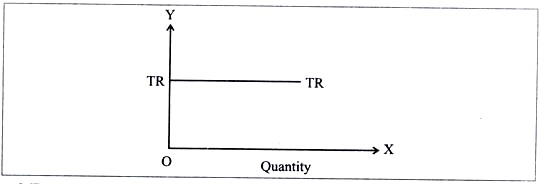
MR is zero and hence its curve coincides with the x- axis
Q.16. The market demand curve for a commodity and the total cost for a monopoly firm producing the commodity is given by the schedule below. Use the information to calculate the following:
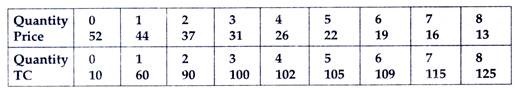
Ans. (a) The MR and MC schedules.
(b) The quantities for which the MR and MC are equal.
(c) The equilibrium quantity of output and the equilibrium price of the commodity.
(d) The total revenue, total cost and total profit in equilibrium,
(a) Revenue Schedules:


For Equilibrium MR = MC for a given quantity.
MR = MC when quantity is 6 units.
Equilibrium quantity of output is when MR = MC
Equilibrium Quantity = 6 units And Equilibrium Price = Rs 19
TR = 114
TC = 109
Total Profit = TR-TC
= 114-109 = Rs 5