
Read this article to learn about the rationale behind the present value criterion for investment.
To know the rationale behind the present value criterion, let us take an example of a firm which produces output for sales and yields income to its owners.
The firm arranges income yields to its shareholders between different time periods in such a way so that the owners may maximize their utility out of a stream of real consumption.
The firm produces output for sale during its life time say n years with the given amount of resources in each year. Let us consider periods from O to L. The possibilities are that the net revenues generated by the firm out of the sale can either be distributed among its shareholders or owners as income, Y0….. Y1 or invested to produce more output in some future year or both i.e., a part of income is distributed and a part is reinvested.
ADVERTISEMENTS:
Meaning thereby, if owners want to increase their future income, they will have to reduce their current income so as to enable the firm to invest their retained income. This will increase future output and hence future income of the owners. It means that increase in income in any year, YL requires a decrease in some previous period/year. Increase in income YL, can also come about by reducing investment in L year. This situation can be expressed by the production possibility curve with diminishing returns.

The situation can be better stated if we hold the income of two periods i.e., Y0 and Y1 as constant. Then an increase in the income of one year requires a decrease in the income of the other. With the resources, the firm faces the problem to choose the set of income, Y’s that will enable the owners to maximize the utility. On the income possibility curve, the owners can trade income in time 0 for income in time l by making changes in the investment level.
With the given resources the firm can produce any pair of income Y0, Y1 on the income possibility curve given in Fig. 18a.2. With the maximum income (Y0) of period 0, the firm can trade income of time 0 for income in time l through increasing investment.

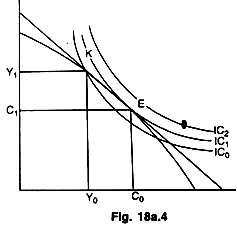
At K on the income possibility curve the firm produces Y0, Y1 pair of income at the end of period 0 and l respectively, with the available resources as shown in the diagram above. When k pair of income is adopted by the firm as an income stream then the owners formulate their consumption plan.
As per their consumption plan they can borrow or lend to a consumption point along a budget constraint line with slope— (1 + r). In this income plan (Y0, Y1) the income may be unequal or uneven over these two periods. But to maximize utility the consumer would like to have a smooth and constant consumption expenditure. Hence, he/she would lend in a period of higher income level. The lent income would be consumed during the period of lower income. The income of the two periods must be equal to the consumption of two periods.
![]()
This is true for income consumption relation over a number of years or life time of the consumers. After the choice of the pair of income Y0,Y1 we can draw the budget constraint line. The consumer can find equilibrium only on the budget line. The maximum income which can be spent in period O is the Y0 plus the present value of income of period 1 assuming that consumption level of income of period 1 is zero.
ADVERTISEMENTS:
This is shown by Y0+ Y1/1+r on the expenditure of period 1 can be equal to income of period 1 (Y1,) plus the income of 0 period with interest Y0(l + r) assuming his consumption expenditure to be nil in 0 periods. This is shown on the vertical axis as Y1 + Y0 (I + r). If we join these two points we get a budget constraint line.
We can get slope of the budget line as under:
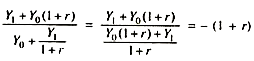
Consumption expenditure can exceed or be less than income in a particular period which is adjusted by lending or borrowing at a rate of interest determining the slope of the budget line. This happens so because the pair of income (Y0,Y1) if spent on consumption i.e., if consumption of each period is equal to the income of that very period, may not yield the maximum satisfaction as shown by the following diagram.