Investment and Demand Schedule!
The behaviour of investors in respect of new investment is conceived in the context of the schedule of the marginal efficiency of capital or Investment-Demand Schedule.
It shows a functional relationship between the MEC and the amount of investment in a given type of capital asset at a particular period of time.
Investment is the independent variable and the MEC is the dependent variable. As more and more investment is made in a capital asset, its MEC continues to fall. This is indicating that the demand for capital asset of any given type is a decreasing function of the marginal efficiency of capital.
ADVERTISEMENTS:
For “if there is an increased investment in any given type of capital during any period of time, the marginal efficiency of that type of capital will diminish as the investment in it is increased, partly because the prospective yield will fall as the supply of that type of capital is increased, and partly because, ‘as a rule pressure on the facilities for producing that type of capital will cause its supply price to increase.”
In other words, as investment in a particular capital asset increases, its marginal efficiency decreases. The marginal efficiencies of all types of capital assets arranged in an ascending order which may be made during a given period of time represent the schedule of the marginal efficiency of capital (also called the investment schedule).
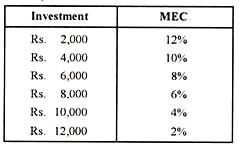
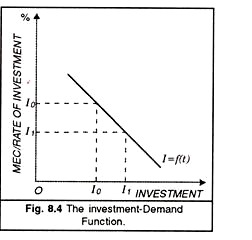
The position and shape of the investment-demand schedule are of major significance in determining the volume of income and employment. Therefore, we must be as clear as possible about it. The following table and Figure 8.4 given above show the shape of the investment demand schedule.
In the above-given table when investment is Rs. 2,000, the MEC is 12%. As the investment increases, the MEC declines continuously and finally it drops to 2% at Rs. 12,000. The investment-demand schedule when depicted graphically gives us the Investment-Demand Curve.
We measure MEC along the vertical axis and investment along the horizontal axis. The MEC curve is downward sloping showing that the MEC curve of a particular machine declines with an increase in investment. Figure 8.4 depicts the investment demand curve or what is also called the MEC schedule.
It shows the inverse relationship between investment and the MEC. For any rate of interest measured on the vertical axis the curve shows the level of investment demand at which the MEC will be brought into equality with that rate of interest. It is a demand curve for investment from a particular firm. Summing the MEC-schedule of all firms gives the demand for investment in the economy as whole.
Relative Role of MEC and the Rate of Interest:
MEC and the rate of interest are the two important factors which affect the volume of investment and these two must be determined before-hand independently of each other. MEC is the result of the supply price and the prospective yield of the capital asset Rate of interest is the price paid for loanable funds and the determined, like any other price, by the demand for and supply of loanable funds.
ADVERTISEMENTS:
A potential investor will go on weighing the MEC of new investment against the prevailing rate of interest. As long MEC is more than the rate of interest, investment will continue to be made till the MEC and the rate of interest are equalised. Once the MEC becomes equated to the rate of interest, equilibrium investment is determined.
Therefore if investment has to be increased either the rate of interest should fall or MEC should increase.
In this connection D. Dillard remarks:
“When it is recalled that employment cannot increase without an increase in investment, the propensity to consume being unchanged, the importance of the relationship of the marginal efficiency, to the rate of interest for the problem of employment will be appreciated as being the most fundamental significance”.
It is true that both MEC and the rate of interest are important determinants. But Keynes’ contribution relates chiefly to the latter. He effectively pointed out that investment demand is interest inelastic and the MECC influences investment much more than the rate of interest.
Thereby he gave a realistic touch to investment policy and as a result of his analysis we now place less emphasis that before on the rate of interest as a means of increasing the volume of investment.
The rate of interest is very important in the effective implementation of fiscal policy (specially debt management). But as a means of affecting private investment it could be of importance (as a determinant of income and employment), if the marginal efficiency schedule were highly elastic.
Keynes in the General Theory attributed fluctuations to the changes in expectations and the resulting shifts in the MEC and not to the rate of interest. He says, We have been accustomed in explaining the ‘crisis’ to lay stress on the rising tendency of the rate of interest under the influence of the increased demand for money both for trade and speculative purposes.
At times this factor may certainly play an aggravating and, occasionally perhaps, an initialing part. But I suggest that a more typical and often the predominant explanation of the crisis is not primarily a rise in the rate of interest, but sudden collapse in the marginal efficiency of capital.
ADVERTISEMENTS:
However the continued to stress in his General Theory the relative rule of the MEC and the rate of interest as determinants of the amount of investment and hence of employment.
The following table depicts clearly the relationship of MEC and the rate of interest in the determination of the inducement to invest.
In this table, it is assumed that the new capital asset in question gives a constant return of Rs. 1,000 annually. The MEC and the rate of interest are given independently in separate columns, having been determined independently of each other.
ADVERTISEMENTS:
When MEC (4%) is equal to the rate of interest (4%) effect on investment is neutral; when it is more, the effect is favourable and when MEC is less than the rate of interest, the effect on induced investment is unfavorable.
Interest-inelasticity of the Investment-Demand Schedule:
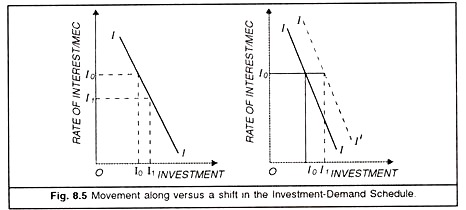
The exposition of the concept of MEC schedule given below seems to imply that investment demand depends on level of interest rates. For example, in Fig. 8.5 it appears that a reduction in interest from r1 to r2 would raise demand from I1 to I2. But the available evidence suggests that business firms pay relatively little attention to interest rates while deciding to invest in new assets.
It seems that the MEC schedule is likely to be fairly inelastic with respect to the rate of interest, and that the level of investment demand depends to a considerable extent on other influences which, when they change, shift the whole curve. There is a large number of short term and long term factors which together determine the shape and position of the investment demand schedule of a firm and rate of interest is just one of them.
ADVERTISEMENTS:
The position and shape of the investment-demand schedule play a deciding role in determining the volume of investment because they show the extent to which the amount of investment changes as a result of changes in the rate of interest.
If the investment demand (MEC) schedule is relatively interest-elastic, a little fall in the rate of interest will lead to a considerable increase in investment. On the other hand, if the investment-demand schedule (MEC schedule) is relatively interest- inelastic, there will be little increase in investment, though the fall in the rate of interest may be considerable.
Shifts in Investment-demand:
The investment-demand curve can shift to the left or to the right-hand side.
The main factors leading to the shifts in the curve are as under:
1. Acquisition, Maintenance and Operating Costs
2. Business Taxes
ADVERTISEMENTS:
3. Technological Change
4. The Stocks of Capital Goods
5. Expectations
1. Acquisition, Maintenance and Operating Costs:
If the costs of obtaining, operating , and maintaining capital assets rise, the MEC of prospective investment projects with fall, shifting the investment-demand curve to the left. Conversely, if these costs decline, MEC will rise shifting the investment demand curve to the right. It should be noted that the wage policies of unions may affect the investment-demand curve because wage rates are a major operating cost.
2. Business Taxes:
Businessmen consider expected profits after taxes in making their investment decisions. Hence, an increase in business taxes will lower MEC and tend to shift the investment-demand curve to the left. On the opposite, a tax reduction will tend to shift it to the right.
3. Technological Change:
Technological progress is a basic stimulus to investment. When a more efficient machine is developed, it will, lower costs of production thereby increasing the MEC of this investment. Profitable new products induce a spurt in investment. A rapid rate of technological progress shifts the investment-demand curve to the right and vice versa.
4. The Stocks of Capital Goods:
ADVERTISEMENTS:
In case there is a big stock of capital goods in hand in an industry, additions to demand can be easily met by reducing the stock. Or if there is enough excess capacity in an industry, the MEC of the capital goods produced there would be low.
On the other hand, if the capacity in an industry is already fully used, additional demand for its output will induce additional investment. Thus, we can say that excess productive capacity tends to shift the investment-demand curve to the left; a shortage of capital goods shifts it to the right.
5. Expectations:
Private investment is based on expected profits. Since capital goods last for a number of years investors have to form expectations of the likely profitability of future sales and future profitability of the product which the capital goods help to produce. If businessmen are optimistic about future business conditions, the investment demand curve will shift to the right. A pessimistic outlook will shift it to the left.


