Let us make in-depth study of the volume of India’s foreign trade and trade balance in India’s exports and imports.
Volume of India’s Foreign Trade and Trade Balance:
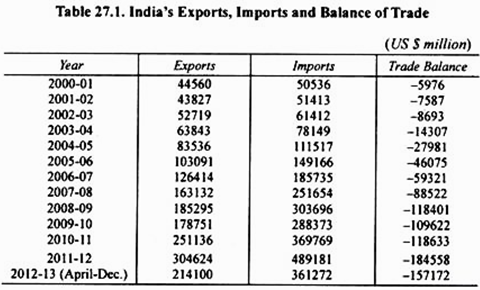
In Table 27.1 we have given the value of India’s exports and imports and trade balance since 2000-01.
It will be seen from the table that value of India’s exports increased from 44,560 million US dollars in 2000-01 to 178751 million US dollars in 2009-10—about 400 times increase in 10 years period.
Further, it will be seen that value of imports of India increased from 50536 million US dollars in 2000-01 to 288373 million US dollars in 2009-2010, that is, more than 400 times increase in ten years period. As a result, larger increase in imports as compared to growth in exports, deficit in our trade balance which was 5976 million US dollars in 2000-01 rose to an alarming figure of 109622 million US dollars in 2009-10, and farther to 184558 million US dollars in 2011-12.
Composition of India’s Exports:
One of the important aspects of foreign trade of a country is its commodity structure, that is, its composition. The composition of India’s exports has greatly changed over 60 years of planned development. In 2011-12 value of India’s exports amounted to 304624 million US dollars, of which agriculture and allied products accounted for 37618 million US dollars, ores and minerals accounted for 8546 million US dollars, manufactured goods contributed 201237 million US dollars, mineral fuels and lubricants accounted for 57015 million US dollars.
Among exports of agriculture and allied products, coffee, tea, oil cakes, tobacco, cashew kernels, spices, fish and fish preparations were major export products. Among ores and minerals, iron was the major article of export.
Among the industrial manufactured goods, prominent export products are textile products; readymade garments, jute manufactures, leather and leather products, handicrafts, gems and jewellery, chemical and chemical products, engineering products such as machinery, transport and metal products, iron and steel.
Change in Composition of Exports:
Indian exports are broadly classified as traditional and non-traditional exports. Jute manufactures, tea, cotton textiles, mineral ores, raw hides and skins, cashew nuts, unmanufactured tobacco and spices have for long been the main export items, so that they are known as India’s traditional exports.
ADVERTISEMENTS:
Recent years have witnessed the emergence of several new export items, which may therefore be called the ‘non-traditional’ items. Some of such exports such as engineering goods (i.e., machinery transport and metal products, iron and steel & chemicals and chemical products) have, in fact, now become even more important than the traditional items in the country’s commodity exports.
The rising share of non-traditional items in our export trade is indication of the industrial development of our economy. The substantial rise in the exports of engineering goods and chemical products is the direct outcome of India’s industrial development in the last 60 years of economic development.
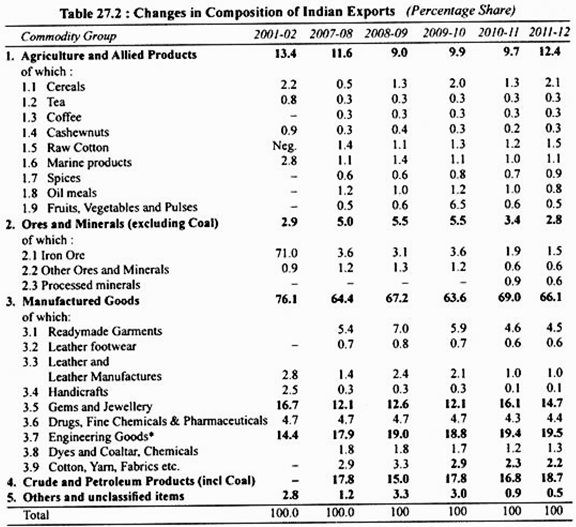
In Table 27.2 we have given the percentage shares of various export commodities in our exports for the years 2001-02 to 2011-12. It will be seen from this table that share of agriculture and allied products in our exports which was 44.2 per cent in 1960-61 fell to 13.4 per cent in 2001-02 and was about 12.4 per cent in 2011-12. Similarly, the share of primary products (i.e., ores and minerals) which was 8.1 per cent in 1970-71, fell to 2.8 per cent in 2011-12.
Compositional changes in India’s export basket have been taking place over the years. While the share of primary products in India’s exports fell over the years from 16 per cent in 2000-01, in 2012-13 (April-November) it regained the share of 16 per cent mainly due to the export of agricultural items like rice and guar gum meal.
ADVERTISEMENTS:
The share of manufacturing exports fell drastically from 78.8 per cent in 2000-1 to 66.1 per cent in 2011-12 and further to 64.5 per cent in 2012-13 (April-November) mainly due to the fall in shares of traditional items like textiles and leather and leather manufactures even though the share of engineering goods and chemicals and related products increased.
Share of gems and jewellery fell marginally. Share of petroleum, crude and products exports, which also include refined items, increased from 4.3 per cent in 2000-1 to 18.3 per cent in 2011-12 and to 18.6 per cent in 2012-13 (April-November).
The destination-wise exports of major items to the major trading partners from 2009-10 to 2012-13 (April-November) show great changes in the composition of exports to USA and China. In the case of India’s exports to the USA, the share of exports of primary products has increased from 6.8 per cent in 2009-1 0 to 21.3 per cent in 2012-13 (April-November), mainly due to the rise in share of agriculture and allied products, while the share of manufactured goods in India’s exports to the USA has fallen from 89.1 per cent to 74.2 per cent during the same period.
This decline has been mainly due to the fall in growth rates of exports of textiles and gems and jewellery. In the case of India’s exports to China, the share of primary products has fallen from 65.7 per cent in 2009-10 to 38.4 per cent in 2012-13 (April- November) due to the fall in share and growth rate of ores and minerals.
The share of manufactures in India’s exports to China has increased from 32.2 per cent to 58.0 per cent during this period, mainly due to the rise in share of engineering goods, textiles, and chemicals and related products. In the case of India’s exports to the EU, there has been a marginal rise in the share of primary products and petroleum products and a fall in the share of manufactured goods.
The reason for India’s export growth in 2012-13 (April-November) being more negative than in 2009-10 in the aftermath of the global recession can be seen from India’s commodity-country export performance. India’s exports to EU and China have been more negative during the recent global slowdown than in 2009-10, while its performance to USA has been better for most of the sectors except gems and jewellery.
The performance of India’s exports to EU of textiles and readymade garments, gems and jewellery and ores, and to China of manufactures, engineering goods, chemicals, gems and jewellery and ores was worse off in 2012-13 (April-November) compared to 2009-10.
India’s POL export growth to all major markets also decelerated in 2012-13 (April-November) compared to 2009-10. Thus, the Euro Zone crisis and the Chinese slowdown have affected India’s exports more during the recent slowdown than in 2009-10.
Export Diversification:
ADVERTISEMENTS:
In 2011, India had a global export share of 1 per cent or more in 53 out of a total of 99 commodities at the two-digit harmonized system (HS) level. While noticeable changes can be seen in India’s market diversification, the same is not the case with its product diversification.
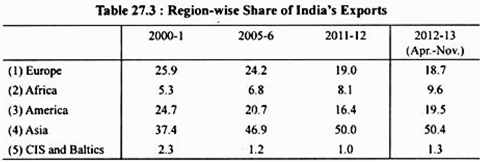
India has been fairly successful in diversifying its export markets from developed countries like the US and Europe to Asia and Africa, which has helped to a great extent in weathering the global crisis of 2008 and the recent global slowdown (Table 27.3). However, in terms of product diversification a lot more needs to be done.
We thus see that composition of India’s exports has significantly changed during the 60 years of economic development since 1951. Thus, while in the beginning of planning era, raw materials and foodstuffs predominated in the country’s exports, now as a result of industrialisation under the Five Year Plans, manufactured articles are the most important class of exports.
ADVERTISEMENTS:
The commodity composition is now broader and vastly diversified. The country has now come out of the stage of being an exporter of primary products. Further, in the pattern of our exports over the six decades of planned development (1951-2010), three main trends can be discerned.
Firstly, among commodities which are directly or largely based on agricultural production (which still account for the bulk of India’s exports), such as jute manufactures, tea, cotton textiles, hides and skins, spices and tobacco on the whole, exports have not improved. The share of traditional exports has been declining.
Of the total exports in 1950-51, tea, jute manufactures and cotton manufactures—India’s traditional exports—represented 56 per cent. This proportion fell to about 6 per cent in 2009-10.
The share of exports of gem and jewellery in India’s total export which was just 2.9 per cent in 1970-71 rose to about 16.5 per cent in 2004-05 and in 2009-10 stood at 12.1 per cent. Thus, India’s exports are hot now as greatly concentrated on the traditional exports as they used to be.
ADVERTISEMENTS:
Secondly, significant increases have been achieved in the exports of new manufactures like engineering goods, leather and leather manufactures, chemicals and allied products and handicrafts and products like iron ore. The growth of exports have now offset the decline in the traditional exports.
The share of exports of engineering products which was hardly 4.5 per cent of total exports in 1960-61 and 12.9% in 1970-71 has improved to about 19 per cent in 2009-2010. Similarly, the share of drugs, fine chemicals and pharmaceuticals which was only 1.9 per cent of total exports in 1970-71 has risen to 4.7 per cent in 2009-10.
The export composition has further seen major changes in the decade (2000-2010) with a 10 percentage point fall in shares of manufactures, a 12.6 percentage point gain in shares of petroleum crude and products, and a 3.3 percentage point fall in shares of primary products.
This trend continued during the-last three years, i.e. from 2008-09 to the first half of 2010-11, with the share of the major category, i.e. manufactures, stagnating at 68.9 per cent and even falling to 64 per cent in 2009-10; share of primary products (including agricultures) falling to 10 per cent in 2009-10; and share of crude and petroleum products increasing to around 18 per cent in 2009-10.
Within manufactures, compared to 2000-01 the share of engineering goods has increased substantially while that of textiles including readymade garments (RMG) has fallen heavily from 23.6 per cent in 2000-01 to 5.9 per cent in 2009-10. The chemicals and related products category has made some gains in share, while leather and leather manufactures and handicrafts have lost their shares.
Composition of India’s Imports:
The strategy of import substitution adopted in the major part of planned economic development in India in the last fifty years involved to restrict imports to essential consumer goods, raw materials and capital goods required for domestic production and for expansion of exports. The pattern of India’s imports reflects the impact of import-substitution strategy of development followed in India.
ADVERTISEMENTS:
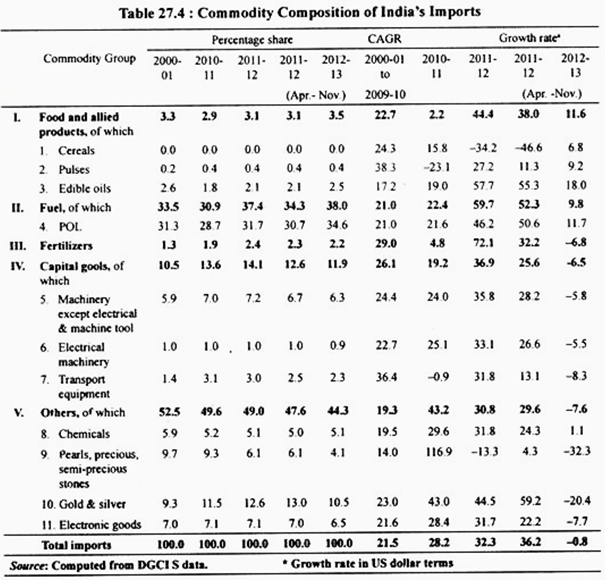
There have been some significant compositional changes in India’s import basket in recent years. The share of POL imports increased from 28.7 per cent in 2010-11 to 31.7 per cent in 2011 -12 (with a very high growth rate) and 34.6 per cent in 2012-13 (April-November). The share of gold and silver imports increased from 9.3 per cent in 2000-1 to 12.6 per cent in 2011-12 with a high import growth rate of 44.5 per cent.
However, in part due to policy measures like raising import duty on gold, from 4 per cent to 6 per cent in Budget for 2012-13 there was a moderation in gold and silver imports in 2012-13 (April-November) with its share falling to 10.5 per cent following a negative growth of -20.4 per cent.
The import share of pearls, precious and semi-precious stones also fell sharply in 2011-12 to 6.1 per cent following a negative growth of -13.3 per cent and further to 4.1 per cent in 2012-13 (April-November), with a high negative growth rate of -32.3 per cent.
Another important development is related to the share of capital goods imports which increased from 10.5 per cent in 2000-1 to 13.6 per cent in 2010-11 and further to 14.1 per cent in 2011-12, declining thereafter to 11.9 per cent in 2012-13 (April-November) following a negative growth rate of-6.5 per cent.
Among capital goods, the import shares of all items of machinery except electrical and machine tools, transport equipment, project goods, and electrical machinery fell, clearly signaling a slowdown in industrial activity. The share of electronic goods, which includes both consumer electronics and capital goods, also fell in 2012-13 (April-November) as is seen from Table 27.4.
India’s Import Growth:
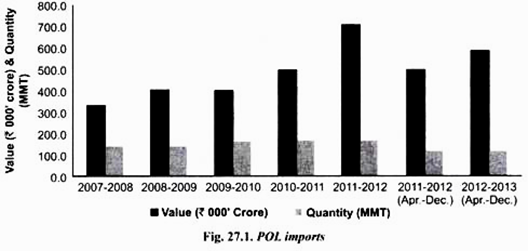
After recovering in 2010-11 from the previous year’s fall, India’s merchandise imports increased further to US $ 489.2 billion with a growth of 32.3 per cent in 2011-12. This was due to the increase in growth of petroleum, oil, and lubricant (POL) imports by 46.2 per cent and non-POL imports by 26.7 per cent. POL imports (with a share of 31.7 per cent in India’s total imports) registered a high growth mainly due to increase in import price of the Indian crude oil import basket by 31.5 per cent in 2011 -12 as against 22 per cent in 2010-11.
POL import volume growth decelerated from 14.9 per cent in 2009-10 to 3.7 per cent in 2010-11 and 3.5 per cent in 2011-12. International oil prices (Brent) which reached a high of US $ 132.47/bbl in July 2008 declined sharply to US $ 40.35/bbl in December 2008, following the global recession.
From 2009 onwards, oil price has been increasing with intermittent volatility, reaching US $ 125.33/ bbl in March 2012 and falling marginally with volatility in the following months. Currently Brent oil price is hovering around US $ 110/bbl.
Gold and silver imports (with a share of 12.6 per cent in India’s total imports) grew by 44.5 per cent in 2011-12. Gold imports alone accounted from 91.7 per cent of the total imports of gold and silver. In 2011 -12, gold imports grew by 38.8 per cent in value and 11.2 per cent in volume terms. Non- POL non-bullion imports increased by 23.3 percent in 2011-12 compared to 29 per cent in 2010-11.
At US $ 406.9 billion imports in 2012-13 (April-January) registered a growth of 0.01 per cent. During 2012-13 (April-December), POL imports at US $ 125.2 billion grew by 12.8 per cent. Non-POL imports at US $239.8 billion declined by 5.1 percent and gold and silver imports at US $ 39.3 billion declined by 14.7 per cent. Non-POL and non-bullion imports which basically reflect the imports of capital goods needed for industrial activity and imports needed for exports declined by 3.0 per cent.
Export Diversification of India:
In 2009, India had a global export share of 1 per cent or more in 48 out of a total of 99 commodities at the two-digit Harmonized System (HS) level, but a significant share of 5 per cent or more in 12 items (Table 27.5). Among these, three items, pearls, precious stones, metals, coins, etc., man-made filaments; and ores, slag, and ash had an increase in global share by 0.5 per cent point or more in 2009 over 2008.
ADVERTISEMENTS:
Six items, which include silk; carpets and other textile floor coverings; lac, gum, resins, vegetable saps and extracts; cotton; vegetable plaiting materials, vegetable products; and coffee, tea, mate, and spices, lost global shares in 2009 over 2008.
Noticeable is the near doubling in share of pearls, precious stones, metals, coins, etc., with growth in trading activity, and the fall of nearly 2 percentage points in lac, gums, resins, vegetable saps, and extracts, due to crop failures coupled with competition from substitute products and competing countries. Of the remaining 38 items, 11 lost their shares in 2009 over 2008.
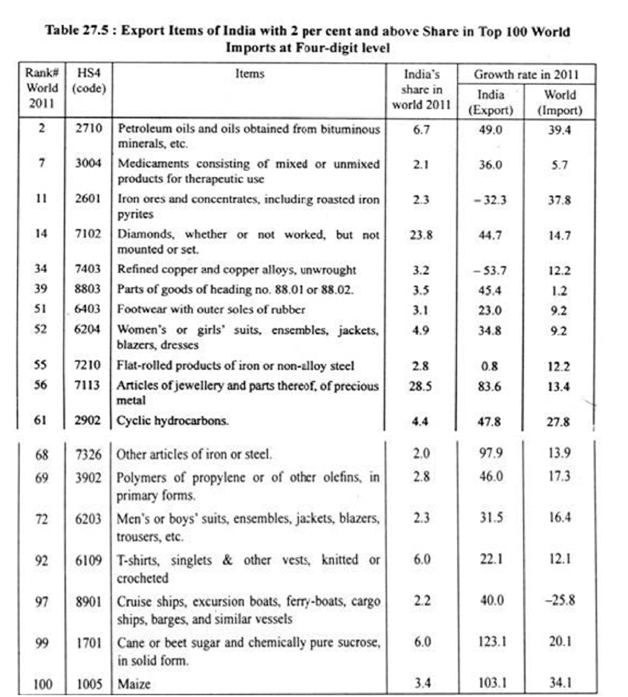
In the top 100 imports of the world at the four-digit HS level in 2011, India has only 6 items in the top 50; it has only 5 items with a share of 5 per cent and above and 18 items with a share of 2 per cent and above (Table 27.5), with 6 new items with high export growth (India) entering the list and 3 going out of the list in 2011 compared to 2010.
The new items are medicaments consisting of mixed or unmixed products for therapeutic use; other articles of iron and steel; men’s or boys’ suits, ensembles; cruise ships, excursion boats, ferry-boats, cargo ships, barges and similar vessels; cane or beet sugar and chemically pure sucrose in solid form; and maize.
India has a very high export share in world imports in the case of only two four-digit HS items, jewellery and diamonds. While India can increase its shares further in the other 16 items given in the table, there are many other simple items in the top 100 world imports with high demand where India has developed its competence.
ADVERTISEMENTS:
Most of the items come under the three Es, electronic, electrical, and engineering items and some textiles items. Greater focus on these items could lead to a perceptible increase in India’s share of exports in world imports.
Direction of India’s Foreign Trade:
There has been significant market diversification in India’s trade. Region-wise, while India’s exports to Europe and America have declined, its exports to Asia and Africa have increased. However, in 2012-13 (April-November), the share of India’s exports to the USA increased to 13.5 per cent.
Within Asia, while the share of North East Asia (consisting of China, Hong Kong, Japan) and ASEAN (Association of South East Asian Nations) fell from 14.8 per cent and 12.0 per cent in 2011-12 to 13.1 per cent and 10.3 per cent respectively in 2012-13 (April-November), there was a noticeable rise in the share of West Asia-GCC (Gulf Cooperation Council) countries from 14.9 per cent in 2011-12 to 17.7 per cent in 2012-13 (April-November).
In 2012-13 (April-November), compared to 2000-01, the share of India’s imports from Europe has declined to 16.7 per cent from 27.6 per cent, while that from Asia has increased substantially to 61.1 per cent from 27.7 per cent.
The share of America in India’s imports also increased to 11.5 per cent from 7.9 per cent. India’s top 15 trading partners have nearly 60 per cent in share in its trade with the top three contributing nearly half of this share. While Iran and UK are out of this top 15 list in 2011-12, Iraq and Kuwait are the new entrants.
The musical chairs for the top slot among the top three trading partners seems to be continuing with the USA relegated to third position in 2007-8 from first, UAE relegated to second position from first in 2011-12 by China, and China in turn relegated to second position by the UAE in 2012-13 (April-November).
The final word for 2012-13 is not yet out as the USA is inching closer to China with its share increasing by around one percentage point and that of China falling. At 10 per cent in 2011-12 India’s trade deficit as a per cent of GDP is one of the highest in the world. Export-import ratios reflecting the bilateral trade balance show that among its top 15 trading partners, India had bilateral trade surplus with four countries in 2011-12, viz. the UAE, USA, Singapore, and Hong Kong.
In 2012-13 (April-November), India’s trade balance with the UAE has turned slightly negative while it has improved further with the USA and Hong Kong. Another important trend is the growing trade deficit of India with China and Switzerland, increasing from $ 28 billion and $ 24.1 billion in 2010-11 to $ 39.4 billion and $ 31.3 billion respectively in 2011-12. In 2012-13 (April-November), the export-import ratio with China worsened further to 0.23 from 0.31 in 2011 -12.
