Let us make in-depth study of the performances of foreign trade sector in India’s exports and imports.
Introduction:
The severity of economic crisis of 1991 provided an opportunity to the Government to make far-reaching changes in macroeconomic policy.
There was liberalisation of domestic investment by removing direct controls on private sector and adopted fiscal and monetary policies to promote growth.
Besides, the New Economic Policy pursued since 1991 also liberalized foreign trade and investment. The growth strategy was made export-oriented. Not only quantitative restrictions on imports have been removed but also customs duties have been drastically reduced.
ADVERTISEMENTS:
Thus efforts have been made to integrate the Indian economy with the global economy. Rupee was devalued in 1991 and from 1993 exchange rate of rupee was made market-determined. It is, therefore, important to know how India’s foreign trade sector has performed in response to these important changes in economic policy framework.
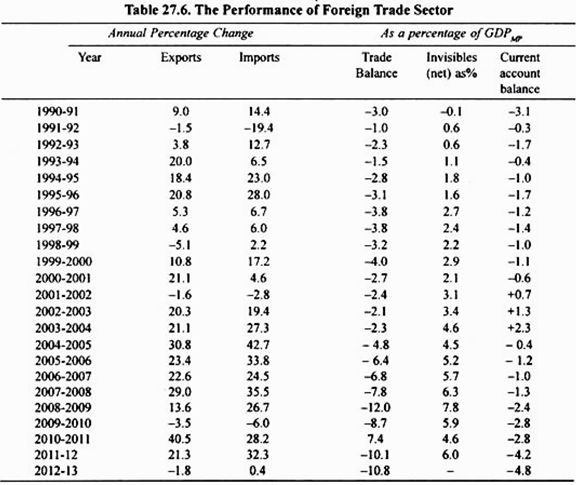
The performance of foreign trade since 1991 is shown in Table 27.6 which reveals that after a transition period of 2 years, merchandise exports grew at about 20 per cent a year in dollar terms for three successive years during 1993-94 to 1995-96. Then due to slowdown in world trade and recession in the USA which is India’s major trade partner, annual growth of exports slowed down from 1996-97 to 1999-2000.
However after 2000 up till 2007-08 with the exception of year 2001 -02 there was more than 20 per cent annual growth of exports on sustained basis for over eight years (2000 to 2008) and in 2007-08 average annual growth rate of our exports was around 29 per cent.
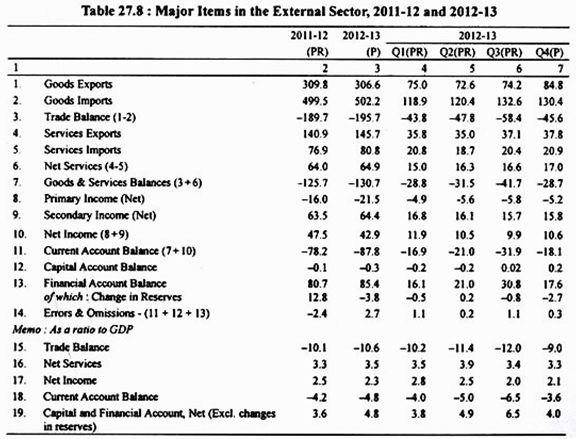
Despite the sluggish performance of exports from 1996-97 to 1998-99 deficit in trade balance remained below 4 per cent of GDP (See Col. IV of Table 27.8) due to the equally subdued growth in imports during this period. During the four-year period, 2004-05 to 2007-08, India’s imports grew at a much higher rate due to robust industrial growth relative to growth in our exports and as a result deficit in our trade balance greatly increased; as a percentage of GDP it was 4.8 per cent in 2004-05, 6.8 per cent in 2006-07, and 7.8 per cent in 2007-08.
ADVERTISEMENTS:
Due to global financial crisis and consequent economic slowdown in the US and European countries, the growth rate of our exports fell to 13.6 per cent in 2008-09, whereas imports grew at 26.7 per cent. As a result deficit in our trade balance rose to 12 per cent of GDP.
Bolstered by the measures taken by the government to help exports in the aftermath of the world recession of 2008 and also the low base effect, India’s export growth of 40.5 per cent in 2010-11 reached an all time high since Independence. Though it decelerated in 2011 -12 to 21.3 per cent, it was still above 20 per cent and higher than the compound annual growth rate (CAGR) of 20.3 per cent for the period 2004-05 to 2011-12.
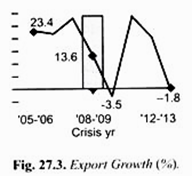
After registering very high growth of 56.5 per cent in July 2011, export growth started decelerating with a sudden fall to single digits in November 2011 as a result of the emerging global situation and then to negative figures from March 2012. Export growth rate in 2012-13 was negative and equal to – 1.8%. For three months in 2012-13, exports declined YOY by double digits with the largest decline recorded in July 2012 at – 15.1 per cent.
ADVERTISEMENTS:
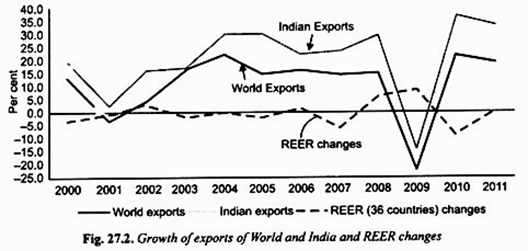
Export growth in dollar terms was negative at-1.8 per cent in 2012-13, compared to 21.3 percent growth in 2011-12 (full year). In rupee India’s export growth has almost continuously been above world export growth in the 2000s decade and in 2011. One issue that has been a topic of debate is whether India’s export growth rate is dependent on world growth/trade or exchange rate. There is a strong correspondence between India’s export growth and world export growth (see Figure 27.2).
This is clearly visible in 2009 when there was a big dip in both world exports and India’s exports. The relationship between changes in real effective exchange rate (REER) and India’s export growth is not however as clear-cut as that with world trade.
Robust Growth in our Invisibles:
An important feature of India’s foreign trade is robust growth of trade in invisibles, especially after 1994-95, and as a result invisibles (net) as a percentage of GDP has been within the range of 2.2 per cent to 5.2 per cent from 1995-96 to 2005-06 and rose to 5.8 per cent in 2006-07. It is because of high growth in invisibles (net) that current account balance of payments has been less than 2 per cent of GDP throughout in 9 years period from 1991- 92 to 2000-01 as compared to the deficit of 3.1 per cent in the pre-reform year 1990-91 (See Col. VI of Table 27.8).
Further, for the first time after several years due to robust growth in invisibles (net) that there was surplus on current account balance for the three successive years, 2001-02 to 2003-04. In the next three years, deficit in current account balance was quite small, 0.4 to 1.2% of GDPmp. Due to global financial crisis and consequent global slowdown the growth of exports fell to 13.6 per cent in 2008-09 and despite good growth in invisibles our current account deficit rose to 2.4 per cent of GDP.
Higher Growth Rate in Exports:
India’s exports have been witnessing 20 per cent plus growth rate since 2002-03 (except for the years 2008-09, 2009-10 and 2012-13 when there was world-wide slowdown due to global financial crisis) and displaying a tendency of moving to higher growth trajectory. The increase in volume of exports is the main contributor to the strengthening of our export performance.
Net terms of trade (which is the ratio of prices of exports to the prices of imports) increased on an average by 1.5 per cent during the 1990s have witnessed a continuous decline since 1999-2000. The decline in prices of exports relative to prices of imports was quite significant in the five years (2002-07) and was caused by the resurgence in international crude oil prices.
ADVERTISEMENTS:
However, the strong growth in exports in volume terms, the income terms of trade which measure purchasing power of exports has consistently improved during the nineties and thereafter.
It is worth mentioning that exports of services (that is, non-factor commercial services) have been playing a significant role in boosting Indian exports. There was an upward shift in the trend growth of services exports (in US dollar terms) from 7.9 per cent in the first half of the decade in the 1990s to 15.3 per cent during 2000-01 to 2003-04.
Software and other miscellaneous services (including professional, technical and business services) have emerged as the main categories in India’s exports of services. From a relatively low share of only 10.2 per cent in 1995-96, share of exports of software services in total exports of services went up to 49 per cent in 2003-04.
Factors Responsible for High Export Performance from 2002-03 to 2011-12 with the exception of 2009-10:
Both external and domestic factors have contributed to the satisfactory performance of exports since 2002-03. The expansion in world trade as a result of global recovery has helped the strengthening of Indian exports. Besides, the expansion in domestic economic activity, especially the manufacturing sector, also substantially contributed to the Indian exports of such goods as engineering goods, readymade garments, textiles.
ADVERTISEMENTS:
The opening up the Indian economy and greater export orientation and corporate restructuring have also enhanced the competitiveness of Indian industries. Recent recovery in international commodity prices and various policy initiatives for export promotion and market diversification taken by the Government also seem to have contributed to the better export performance in recent years.
However, in the year 2007, Indian rupee appreciated more than 11 per cent against US dollar till 2006 as a result of large capital inflows. This appreciation of rupee adversely affected growth of India’s exports.
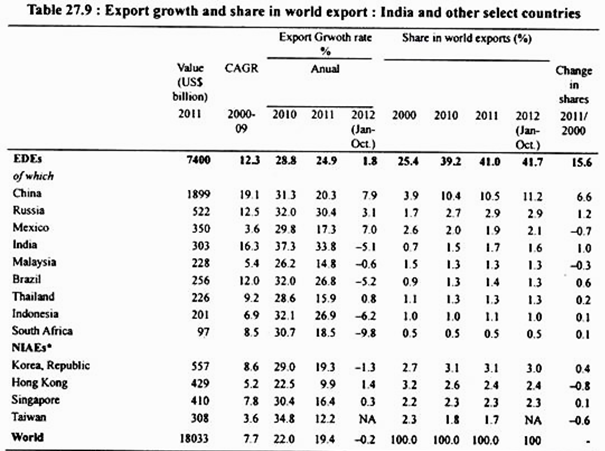
It is interesting to note that since 1995 India’s exports have grown at a rate higher than that of world exports and exports of developing countries as a whole with the exception of two years, 2008-09 and 2009-10 when there was slowdown in the world economy. This is shown in Table 27.9 where we have given export growth rate of world and developing countries as a whole and some other export-oriented countries.
It will be seen from this that CAGR (compound annual growth rate) for the years 2000 to 2007 and annual growth rate for the year 2008, rate of growth of exports of India was not only higher than the growth of exports of world and developing countries (with the sole exception of China) but also of the export growth of countries such as Hong Kong, Malaysia, Singapore, Thailand, Korea which are called Asian tigers who have achieved high growth rates of GDP.
ADVERTISEMENTS:
For example, in the year 2008 while world exports grew by 15.9 per cent and those of the emerging and developing economies (EDEs) by 25.3 per cent, exports of India grew by about 29.7 per cent. China has been an outstanding export performer for years.
However, for the first time in 2005 India’s growth in exports surpassed that of China. It will be seen that in last decade (2000-2010), India’s export performance is better relative to the world as a whole and the developing countries except that of China.
Dismal Export Performance in 2012-13 and 2013-14:
India’s exports battered by the drying up of orders for most part of the year 2012-13 and contracted by 1.8 per cent to $300.6 billion in the year. However, the last quarter of the year, January to March 2013, exports showed positive signs and grew by 6.97 per cent in March 2013. Exports in March 2013 stood at $30.8 billion (Rs. 1,69,400 crore) compared to $28.8 billion (Rs.1,58,400 crore) in the same month of the previous year.
Imports dipped by 2.87 per cent to $41.16 billion in March 2013, leaving a trade deficit of $10.31 billion – down from $13.5 billion in March last year. For the entire fiscal 2012-13, however, exports shrank by 18% to $300.6 billion. Export performance started picking up in the last quarter of the year 2012-13.
For March it picked by a slightly robust figure as compared to the previous two months. It was expected that this trend would continue and help in consolidating. SR Rao, commerce secretary, said, “If the trend continues, exports should grow by at least 10% in the year 2013-14.” Given a very weak performance for major part of the year, 2012-13 it was thought that in the last 3-4 months, we really covered a good deal of ground. “It may not be sufficient, but certainly there was progress in exports,” he said.
ADVERTISEMENTS:
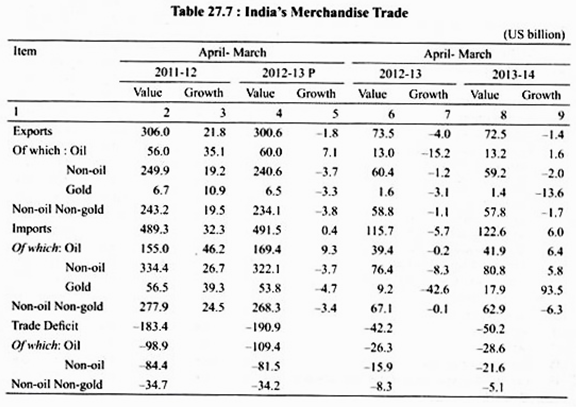
Trends in exports and imports in Q1 of 2013-14 suggest a widening of the merchandise trade deficit. The trade deficit widened from US $ 42.2 billion in Q1 of 2013-14, mainly on account of a sharp increase in gold imports.
Reflecting global demand conditions, exports contracted in May and June 2013 after recording growth for five consecutive months (since December 2012). The engineering goods, gems & jewellery, electronics and iron ore sectors were the main contributors to the decline in exports in Q1 of 2013-14.
In contrast, imports grew by 6.0 per cent in Q1 of 2013-14 as against a decline of 5.7 per cent in Q1 of 2012-13. Gold imports almost doubled from US $9.2 billion in Q1 of 2012-13 to US $ 17.9 billion in Q1 of 2013-14. Notwithstanding a fall of 5.7 per cent in international crude oil prices (Indian basket) in Q1 of 2013-14 (y-o-y), POL imports grew by 6.4 per cent.
Non-oil non-gold imports continued to show contraction, reflecting subdued domestic growth conditions. Apart from gold and POL, the rise in imports of pearls, precious & semi-precious stones, non-ferrous metals and electronic goods also contributed to higher imports in Q1 of 2013-14. (See Table 22.7)
CAD narrowed significantly in Q4 of 2012-13:
The current account deficit (CAD) moderated sharply to 3.6 per cent of GDP in Q4 of 2012-13 from 6.5 per cent in Q3 (4.4 per cent of GDP in Q4 of 2011-12). This was owing to the narrowing of the merchandise trade deficit underpinned by a pick-up in exports and a decline in imports (BOP basis) in Q4.
ADVERTISEMENTS:
However, net service exports remained subdued in Q4 of 2012-13. The moderation in net secondary income compared with Q4 of 2011-12 mainly reflected a fall in the net private remittances from abroad. Further, there was a significant outflow on account of income payments, reflecting growing liability-servicing obligations (See Table 27.8).
Despite the moderation in the CAD in Q4, the overall CAD during 2012-13 at 4.8 per cent of GDP was far above the sustainable level (Table 27.8). Trends in trade data suggest that the CAD may remain high in Q1 of 2013-14. However, in subsequent quarters, the CAD is expected to improve, since the import demand for gold is expected to moderate.
With the end of the gold super-cycle, the speculative demand for gold is likely to decline.
Besides, various measures have been undertaken domestically to curb import demand for gold, that inter alia include:
(i) A hike in customs duty to 10 per cent and
ADVERTISEMENTS:
(ii) Measures towards rationalization of gold imports by both nominated agencies and banks.
In particular, on July 22, 2013, all nominated banks/agencies were instructed to ensure that at least one-fifth of every lot of import of gold (in any form/purity) is retained in customs bonded warehouses for the purpose of export and fresh imports of gold is permitted only after 75 per cent of the retained gold is actually exported.
This new measure replaced the earlier restrictions on import of gold on consignment basis and opening letters of credit subject to 100 per cent cash margin. To some extent, the recently launched inflation-linked bonds were also expected to wean away investors who use gold as a hedge against inflation.
If the current recovery in the US and Japan continues, it may help improve India’s exports to these destinations. The combined influence of these factors may augur well for India’s CAD during 2013-14. To achieve robust growth in exports we need to diversify our exports market and also make them competitive by raising productivity in the export sector.
India’s Export Growth and Share in World Exports:
It will also be seen from Table 27.9 that India’s share in world’s exports rose from 0.7 per cent in 2000 to 1.7 per cent in 2011 and was estimated at 1.6% in 2012 (Jan.-Oct. 2012).
Thus there was 1 per cent increase in 2011 over 2000. Therefore, India presents a success story in case of export performance in the post-reform period. The increase in China’s share of world exports between 2000 and 2011 at 6.6 percentage points was slightly less than one-half of the total increase in the share of developing countries over this period.
ADVERTISEMENTS:
However, China’s export growth rate which was 19 per cent in the period 2000-09, while India’s exports at around 16.3 per cent during 2009-09. However in 2012-13, India’s export growth was negative. The export performance of China is spectacular with is share in world exports increasing by 6.6 percentage points between 2000 and 2011, comprising 42.4 per cent of the total increase in EDEs share over this period, while India’s rise in share of 1 percentage point in 2011 over 2000 constitutes only 6.5 per cent of the total increase.
However, China’s export growth rate at 20.3 percent in 2011 was substantially lower than that of India. India’s export growth rate of 33.8 per cent in 2011 over and above the 37.3 per cent growth of 2010 is one of the highest in the world. India’s share in world merchandise exports which started rising fast from 2004, reached 1.5 per in 2010 and 1.7 percent in 2011.
It declined marginally to 1.6% in 2012 due to its relatively higher negative export growth compared to the negative world export growth. In Contrast China’s share in world exports increased to 11.2% in 2012 (January-October) with a positive export growth of 7.9 per cent (See Table 27.9).
India’s significant export growth in recent years has (expect the years 2012-13 and 2013-14) has been on account of several favourable external developments and domestic policy initiatives. Improved growth of the world economy and recovery in world trade helped the growth of Indian exports. The opening of the Indian economy and restructuring of corporate sector has increased the competitiveness of Indian industry.
Besides, there is a far greater export orientation of domestic industries and corporate sector has been pursuing new growth strategies in response to economic reforms. Expansion of domestic economic activity, especially resurgence of the manufacturing sector, helped in promoting exports.
Further, reforms in India’s foreign trade policy, continuation of foreign trade promotion measures, market diversification and trade facilitation efforts seem to have paid good dividends. The nominal effective exchange rate (NEER) measuring the value of countries’ currency relative to the currencies of principal trading partners is a proximate indicator of its competitiveness in international trade.
The NEER-5 (base 2000 = 100) which is a five currency export-weighted index depreciated till 2004-05 and after a bout of appreciation in 2005-06 depreciated steadily in 2006-07 till August 2006. This depreciation of rupee helped a good deal in promoting exports. However in year 2007, the Indian rupee appreciated over 11 per cent till October 2007.
This adversely affected growth of our exports. Global financial crisis (2007-09) also adversely affected the growth of our exports which registered only 13.6 per cent growth in 2008-09. With global recovery in later half of 2009 and 2010 the growth of Indian exports also picked up.
