These are distinguished into production costs and managerial costs. All costs are variable in the long run and they give rise to a long-run cost curve which is roughly L-shaped.
The production costs fall continuously with increases in output. At very large scales of output managerial costs may rise.
But the fall in production costs more than offsets the increase in the managerial costs, so that the total LAC falls with increases in scale.
Production costs:
ADVERTISEMENTS:
Production costs fall steeply to begin with and then gradually as the scale of production increases. The L-shape of the production cost curve is explained by the technical economies of large-scale production. Initially these economies are substantial, but after a certain level of output is reached all or most of these economies are attained and the firm is said to have reached the minimum optimal scale, given the technology of the industry. If new techniques are invented for larger scales of output, they must be cheaper to operate.
But even with the existing known techniques some economies can always be achieved at larger outputs:
(a) Economies from further decentralization and improvement in skills;
(b) Lower repairs costs may be attained if the firm reaches a certain size;
ADVERTISEMENTS:
(c) The firm, especially if it is multiproduct, may well undertake itself the production of some of the materials or equipment which it needs instead of buying them from other firms.
Managerial costs:
In the modern management science for each plant size there is a corresponding organisational-administrative set-up appropriate for the smooth operating of that plant. There are various levels of management, each with its appropriate kind of management technique. Each management technique is applicable to a range of output. There are small-scale as well as large-scale organisational techniques. The costs of different techniques of management first fall up to a certain plant size. At very large scales of output managerial costs may rise, but very slowly.
In summary: Production costs fall smoothly at very large scales, while managerial costs may rise only slowly at very large scales. Modern theorists seem to accept that the fall in technical costs more than offsets the probable rise of managerial costs, so that the LRAC curve falls smoothly or remains constant at very large scales of output.
ADVERTISEMENTS:
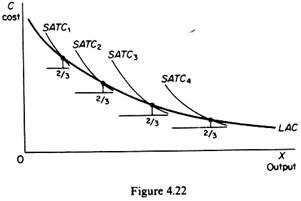
We may draw the LAC implied by the modern theory of costs as follows. For each short-run period we obtain the SRAC which includes production costs, administration costs, other fixed costs and an allowance for normal profit. Assume that we have a technology with four plant sizes, with costs falling as size increases. We said that in business practice it is customary to consider that a plant is used ‘normally’ when it operates at a level between two-thirds and three-quarters of capacity.
Bain writes:
The plant or firm will have a somewhat fluctuating output, over time, and at a given scale will thus operate at a number of somewhat different output rates. Correspondingly, it will have a certain ‘load factor’ reflecting the ratio of average actual rate of use to the capacity or best rate of use, and this load factor will generally be smaller than one.
In this circumstance, the relevant relationship of unit cost to scale is that which prevails when it is assumed that each alternative scale of plant or firm is operated subject to prevailing or anticipated market fluctuations, and is thus subject to a resultant typical load factor on its capacity. The long- run average unit cost of each alternative scale should be calculated on this assumption, and conclusions as to minimum optimal scales and shapes of such curves should be derived accordingly.
Following this procedure, and assuming that the typical load factor of each plant is two-thirds of its full capacity (limit capacity), we may draw the LAC curve by joining the points on the SATC curves corresponding to the two-thirds of the full capacity of each plant size. If we assume that there is a very large number of available plant sizes the LAC curve will be continuous (figure 4.22).
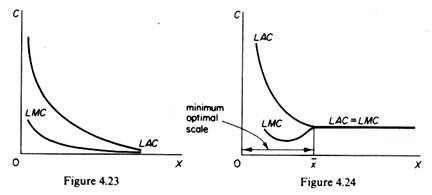
The characteristic of this LAC curve is that (a) it does not turn up at very large scales of output; (b) it is not the envelope of the SATC curves, but rather intersects them (at the level of output defined by the ‘typical load factor’ of each plant). If, as some writers believe, the LAC falls continuously (though smoothly at very large scales of output), the LMC will lie below the LAC at all scales (figure 4.23). If there is a minimum optimal scale of plant (x in figure 4.24) at which all possible scale economies are reaped (as Bain and other writers have suggested), beyond that scale the LAC remains constant.
In this case the LMC lies below the LAC until the minimum optimal scale is reached, and coincides with the LAC beyond that level of output (figure 4.24). The above shapes of costs are more realistic than the U-shaped costs of traditional theory. As we will see in section VI, most of the empirical studies on cost have provided evidence which substantiates the hypotheses of a flat-bottomed SAVC and of an L-shaped LAC.

