The upcoming discussion will update you about the relationship between short-run and long-run costs.
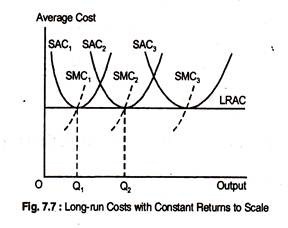
Fig 7.7 shows the case where there are constant returns to scale in the long-run.
If the firm were expected to produce Q1 units of output, then it should build the smallest plant where LAC = SAC1 = SMC1 if the firm is to produce Q2 units of output, the middle-sized plant whose LAC = SAC2 = SMC2 and so on.
With constant returns to scale, the LAC equals the minimum points of the SAC curves.
In the long-run, the firm can change the size of the plant, so if it was initially producing Q1, and wanted to increase output to Q2 or Q3, it could do so without increasing cost.
The LAC curve is given the minimum point of the SAC curves because these show the minimum cost of producing any level of output The IAC curve is the envelope of the SAC curves.
Now, suppose there are many choices of plant size, each of which has a SAC curve that has its minimum — LAC curve is a straight line. Whatever the firm wants to produce, it can choose the plant size that allows it to produce that output at the minimum average cost.
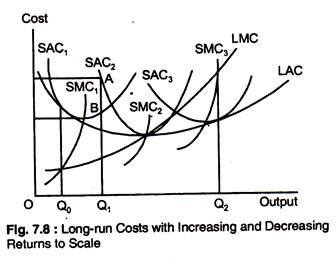
Fig. 7.8 illustrates the increasing and decreasing returns to scale where the LAC curve is no longer a horizontal line and, therefore, of the three plants, the minimum average cost is lowest for a medium-sized plant. The LAC curve exhibits increasing returns to scale initially, but a higher output level shows decreasing returns. We can see the envelope associated with the three plants.
If the firm wants to produce Q1 output, as in Fig. 7.8, building a small plant is relevant (SAC1) plant), so that the & SAC1 is at B. A small plant is a better choice than a medium-sized plant with an AC of production SAC2 at A. Point B would become one point on the long-run cost function when only three plant sizes are possible.
If plants of other sizes could be built, and one size allowed the firm to produce Q1, at less than SAC1, than B would no longer be on the long- run cost curve.
In Fig. 7.8, the envelope that would arise if plants of any size could be built is given by the LACC, which is U-shaped. Note that the LAC curve never lies above any of the SAC curves. Also that the minimum points of the AC of the smallest and largest plants do not lie on the LAC curve because a large plant can take advantage of increasing returns to scale to produce a lower average cost.
Finally, the LMC curve is not an envelope of the SMC curves. SMCs apply to a particular plant; LMC apply to all possible plant size. Each point on the LMC curve is the SMC associated with the most efficient plant.

