
Let us make an in-depth study of the Phillips Curve and Inflation-Unemployment Trade-Off.
Two short-run macroeconomic goals are reasonable price level stability (low inflation) and high employment (low unemployment).
But economic life is full of trade-offs. There is often a conflict between price stability and high employment.
Let us suppose that policymakers adopted stabilisation (monetary and fiscal policies) to expand AD.
ADVERTISEMENTS:
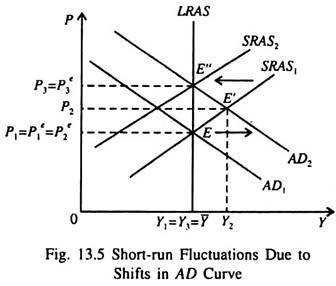
As a result the economy would move along the SRAS curve in Fig. 13.5 from point E to E”, indicating both higher output and high price level. High output (10 can be produced by employing more labour. So this means lower unemployment or higher employment. Firms produce more output only when the general price level shows an upward trend. A rising price level, given the previous year’s price level, means higher inflation.
Thus, when the economy is enabled to move up along the SRAS curve, the unemployment rate falls and rate of inflation rises. The converse is also true. A contractionary stabilisation policy moves the economy down from right to left (from point E’ to E) along the SRAS curve in Fig. 13.5, causing unemployment to rise but the annual inflation rate to fall.
The inverse relation between inflation and unemployment—or the trade-off between the two—is called the Phillips curve.
ADVERTISEMENTS:
We will now show that the Phillips curve is a reflection of the SRAS curve. As the economy moves along the SRAS curve in response to policy changes, unemployment and inflation move in opposite directions. The Phillips curve is a very useful way of expressing the aggregate supply curve. Here we consider both short-run and long-run (expectations-augmented) Phillips curve.
i. Deriving the Phillips Curve from the SRAS Curve:
According to modern macroeconomists the Phillips curve states that the rate of inflation depends on three factors:
(i) Expected inflation;
ADVERTISEMENTS:
(ii) Cyclical unemployment, measured by the deviation of actual unemployment rate from the natural rate of unemployment, and
(iii) Supply shocks (domestic and international).
These three macroeconomic distortions are captured by the following structural equation which summarises the relation among the above three variables:
![]()
where uc = u – un = cyclical unemployment or, actual rate of inflation = expected rate of inflation – (β x cyclical unemployment) + supply shock
Here p is inflation elasticity of unemployment and is negative due to inverse relationship between inflation and unemployment. In order to reduce inflation, society has to tolerate a high rate of unemployment.
ii. The Duality between the Phillips Curve and the AS Curve:
Equation (16) for the Phillips curve is derived from the basic equation for aggregate supply. By a little manipulation of the equation of aggregate supply, viz.,
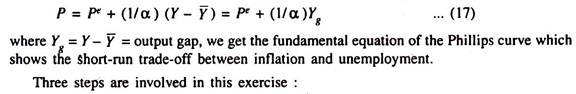
Step 1 Adding a Supply Shock:
ADVERTISEMENTS:
First, we add a supply shock v to the right hand side of the above equation to represent exogenous events (such as a sudden oil price hike) that raise the general price level (because oil is used as the main or subsidiary input in a large number of industries) and shift the SRAS curve to the left:
![]()
where Pt current years actual price level and Pet is current years expected price level
ADVERTISEMENTS:
Step 2 Finding out the Annual Rate of Inflation:
Now we subtract last year’s price level Pt-1, from both sides of equation (18) to arrive at the annual inflation rate (π):
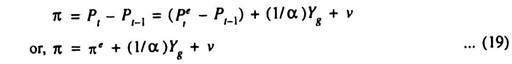
where ne = (Pe – Pt-1) is the expected inflation rate in the current year and is the difference between the expected price level in the current year and the last year’s actual price level.
ADVERTISEMENTS:
Step 3 Using the Okun’s Law:
Now by using Okun’s law we show the relation between output (Y) and cyctical unemployment rate uc. According to Okun’s law, the deviation of actual output from its natural rate is inversely related to the deviation of actual unemployment from its natural rate. This means that when actual output exceeds its natural rate, actual unemployment falls below its natural rate. This relation may be expressed as
![]()
Okun’s law enables us to substitute βuc for (1/α)Yg to arrive at the following equation for the Phillips curve:
![]()
This is how we derive the Phillips curve from the SRAS curve.
ADVERTISEMENTS:
Comments:
Both the Phillips curve equation and the SRAS equation establish a link between real and nominal variables. Since Y and P hang together the classical dichotomy (the theoretical separation of real and nominal variables) breaks down in the short run.
Thus money does exert an influence on the real variables. From the equation for the SRAS curve we find that output is related to unexpected movements in the general price level.
The Phillips curve equation suggests that unemployment is related to unexpected movements in the rate of inflation. While the SRAS curve clearly shows the relation between output and the price level, the Phillips curve establishes the relationship between unemployment and inflation.