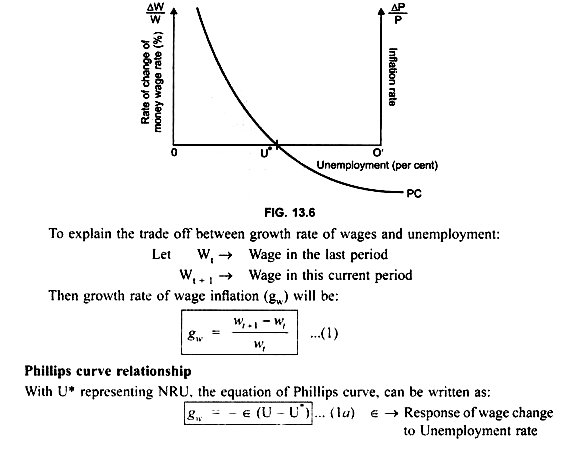
The Phillips curve given by A.W. Phillips shows that there exist an inverse relationship between the rate of unemployment and the rate of increase in nominal wages.
A lower rate of unemployment is associated with higher wage rate or inflation, and vice versa. In other words, there is a tradeoff between wage inflation and unemployment.
Reason: during boom, demand for labour increases. Due to greater bargaining power of the trade union, wage increases.
Thus, decrease in unemployment leads to increase in the wage (Fig. 13.6). But when wage increases, the firms cost of production increases which leads to increase in price. Therefore it is also called wage inflation, that is, decrease in unemployment leads to wage inflation. (Fig. 13.6)
This show that there exists inverse relationship between the rate of unemployment and growth rate of money wages.
The Phillips Curve shows that wages and prices adjust slowly to changes in AD due to imperfections in the labour market.
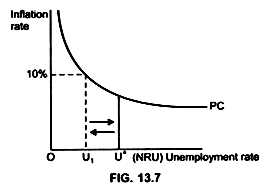
e.g. Assume: Initially, the economy is in equilibrium with stable prices and unemployment at NRU (U*) (Fig. 13.7)
ADVERTISEMENTS:
If Money supply increases by 10%, with price level constant, real money supply (M/P) will increase. This will lead to decrease in interest rate and thus increase in AD which in turn will lead to an increase in both wages and prices by 10% so that the economy reaches back to the full employment equilibrium level (U*) i.e. at NRU.
Thus, Phillips curve shows that when wage increases by 10%, unemployment rate will fall from U* to U1. This will cause the wage rate to increase, but when wage increases, prices will also increase and eventually the economy will return back to the full-employment level of output and unemployment.
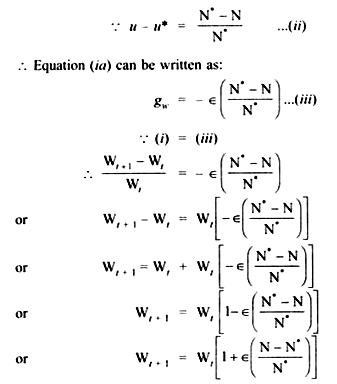
Rewriting equation 1 which shows Relation between wage inflation to unemployment
Equation shows that wages will increase only if U < U*
Since Phillips curve shows a trade off between inflation and unemployment rate, any attempt to solve the problem of inflation will lead to an increase in the unemployment. Similarly, any attempt to decrease unemployment will aggravate inflation. Thus, the negative sloped Phillips Curve suggested that the policy makers in the short run could choose different combinations of unemployment and inflation rates.
In the long run, however, permanent unemployment – inflation trade off is not possible because in the long run Phillips curve is vertical. Since in the short run AS curve (Phillips Curve) is quite flat, therefore, a trade off between unemployment and inflation rate is possible. It offers the policy makers to chose a combination of appropriate rate of unemployment and inflation.
I. Wage – Unemployment Relationship:
(Relationship between gw and the level of employment)
Why are wages sticky? Or Why nominal wages adjust slowly to changes in demand?
According to the Neo-Classical theory of supply, wages respond and adjust quickly to ensure that output is always at full-employment level. This is because wages and prices are completely flexible. Therefore, the economy will always produce full employment output but the Phillips curve suggests that wages adjust slowly in response to changes in unemployment to ensure that output is at full employment level.
Reason:
The wages are sticky and therefore they move slowly over the time. They are not fully and immediately flexible, to ensure full employment at every point in time. To understand wage stickiness, the Phillips curve relationship is translated into a relationship between the rate of change of wages (gw) and the level of employment.
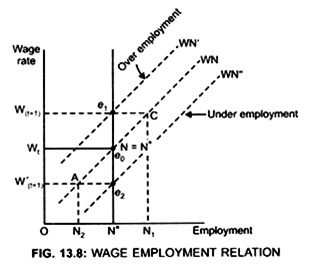
Wage employment relation shows that:
Wages in this period = wages in the last period but with adjustment in the level of employment.
ADVERTISEMENTS:
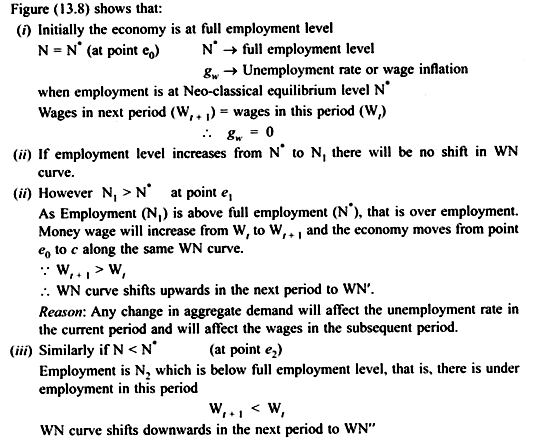
There exists positive relationship between wages and employment because according to Phillips curve any attempt to decrease unemployment will lead to increase in wages. Decrease in unemployment means increase in employment. Therefore, when employment increases wages increase. Thus, the positively sloped WN curve shows that the wage rate paid by firms is higher when more hours are worked.
Joint points A, e0, and C, we get the wage employment line which is positively sloped. However, the extent to which wage responds to employment depends on e (response of money wage growth to change in unemployment).
If є is large — Unemployment has large affects on wage and WN line is steep.
ADVERTISEMENTS:
Conclusion:
The Phillips curve, therefore, also implies that WN relationship shifts over the time if actual employment differs from full employment level. The changes in AD which alter the rate of unemployment in this period will affect wages in subsequent periods. The adjustment to changes in employment is dynamic, i.e., it takes place over the time.
