Prof. J.R. Hicks presented in 1951 a theory of business cycles which is a modified version of the theory put forward by Paul Samuelson in 1939, known as Samuelson in 1939, known as Samuelson’s multiplier-accelerator interaction theory of business cycles. Just like Samuelson’s model, this theory is designed to focus some crucial factors in growth trends and cyclical fluctuations.
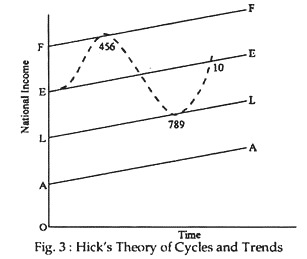
Hicks’ theory is explained in Fig. 3. The first assumption is that investment has two components: an autonomous part and a part induced by changes in national income. Autonomous investment is presumed to grow annually at the rate given by the slope of the line AA in Fig. 3.
That is AA is the line representing autonomous investment. Given the marginal propensity to consume, the simple multiplier is determined. Then the multiplier and autonomous investment together determine the equilibrium level of national income, shown by the line LL, Hicks call this line the floor.
ADVERTISEMENTS:
Hicks also includes induced investment which was ignored by Keynes. If national income grows from one year to the next, as it would along the line LL, there is some amount of induced investment. When induced investment is present, the super-multiplier goes to work.
The line EE shows the equilibrium time patch of national income determined by autonomous investment and the super-multiplier. Finally, the line FF is the full employment ceiling, which shows the maximum national output at any period of time.
Hicks starts at point in Fig. 3. The economy is in equilibrium, moving along the path determined by the super-multiplier and the (growing) level of autonomous investment. Suppose it moves along EE through the points 1-2-3. Next, let there be an external shock—say, a jump in government defence spending, the discovery of a new gold field, etc.—that pushes the economy above the level EE after point 3.
The external shock causes national income to increase at a greater rate than shown by the slope of EE. Therefore, there is an increase in accelerator-induced investment. This, in turn, causes national income to increases, again inducing a higher level of investment.
ADVERTISEMENTS:
The process can continue along the path from 3 to 4, but it must stop at 4 because this is the full-employment ceiling, the limited human and material resources of the economy do not permit a greater expansion of national income. Consequently, when point 4 is reached, the rapid growth of national income must come to an end.
Hicks assumes, reasonably enough, that the full-employment ceiling grows at the same rate as autonomous investment. Hence FF has a moderate upward tilt, but nothing like the slope of the line from 3 to 4. When point 4 is reached, the economy must settle down to growth at the same rate as the growth investment.
It may then temporarily move along the path 4-5-6. But since national income has ceased to increase at the rapid rate shown by the line from 3 to 4, induced investment falls off to the level consistent with this modest rate of growth.
Now comes the downturn. Given the rate of growth in autonomous investment and the super-multiplier, EE is the equilibrium level of national income. The economy cannot crawl along its full-employment ceiling because its equilibrium level is EE. Thus, there is a slackening off at point 6, and the level of national income moves towards EE.
ADVERTISEMENTS:
When the downturn comes, however, national income declines. Thus, there is no induced investment. Therefore EE is no longer the equilibrium level of national income. The super-multiplier is replaced by the regular multiplier of Keynesian variety, and LL is the actual equilibrium level of national income.
The economy must consequently move all the way down from point 6 to point 7. But, at point 7, the floor has been reached. National income will not fall lower because this is the equilibrium level given by the Keynesian multiplier and autonomous investment is EE, the economy must head from point 9 towards point 10.
But it does not shop at 10 because the rate of increase along the line 9-10 exceeds than the rate of increase in autonomous investment that gives rise to EE. Expanding more rapidly, the economy shoots past 10 and heads for the ceiling. Just as in the case of point 4, when the ceiling.
Just as in the case of point 4, when the ceiling is reached, the rapid expansion of national income cannot be sub-stained. The economy may crawl along the ceiling for a short time, but it must ultimately turn down towards EE. With a decrease in national income, however, LL becomes the equilibrium level; so output drops to LL. The process thus continues over time.
The movements shown in Fig. 3 are easy to follow. There is full-employment ceiling that sets a maximum on national output. There is also a minimum or a floor determined by the Keynesian multiplier and the level of autonomous investment.
The economy bounces back and forth between the ceiling and the floor. These general trend given by the upward slope of the autonomous investment curve. The interaction of these two forces—cycles and trends—gives the model as displayed in Fig. 3.
Conclusion:
In conclusion, we may note that this theory is not offered as a formal explanation of a capitalist economy. It does cast light on the general dynamic process by which our economy operates. It can have our ups and downs, yet we have actually maintained a moderate average rate of growth. Hicks’ model simply shows some of the major (basic) forces at work in a capitalist economy.
