
The below mentioned article provides an overview on the Price-Income Line or Budget Line.
To study consumer optimisation behaviour or consumer’s equilibrium the knowledge of price-income line or budget line is necessary. An indifference map indicates preferences of the consumer only. But his actual selection of the two goods depends upon his income and their prices.
According to Prof. Salvatore, “The budget line shows all the different combinations of the two commodities that a consumer can purchase, give his or her income and the price of the two commodities.”
We can explain a price or budget line with the help of a table. Suppose the monetary income of a consumer is Rs.40 which he wants to spend on two goods X and Y. The price of good X is Rs.2 per unit and that of good Y Re.1 per unit. Given his income and prices of two goods, the alternative consumption or expenditure possibilities of a consumer are shown in Table 3.
ADVERTISEMENTS:
It is obvious from the table that the consumer can spend on any of the alternative combinations of goods X and Y. However, if he spends his total income only on good X or Y, he can buy only 20 or 40 units respectively. But this is not possible because he has to buy only a combination of two goods. So he will buy any other combination.

In Figure 12, the various combinations of the table are shown by the BL line. This is the price or budget line. Given Rs.40 with the consumer, he can buy any one combination Q, R or S of goods X and Y. But he cannot obtain any point beyond this line such as combination A because it is out of reach of his income.
On the other hand, he cannot obtain the combination even inside the BL line such as combination N because he cannot spend all income (Rs.40) on both good X and Y. Thus consumer’s budget line is his budget limit or budget constraint line.
ADVERTISEMENTS:
Changes in Price-Income Line:
It is clear from the above analysis as to how many units of the two goods X and Y the consumer can purchase which depend upon his budget and the prices of both the goods. Now, we study as to how a consumer’s budget line will be affected by changes in price and income.

Change in Price:
ADVERTISEMENTS:
If the consumer’s income does not change but the prices of goods X and Y change, the slope of his budget line will change. Suppose that consumer’s income is Rs.40 and the price of good Y (Re. 1) remains constant and the price of good X falls from Rs.2 to Re. 1, his budget line will rotate outwards from point В to the line L2 He can now purchase the maximum 40 units of as shown in Fig. 13. If the price of X increases from Rs.2 to Rs.4. his budget line will rotate inwards from point В to the line and he can purchase to units of X.
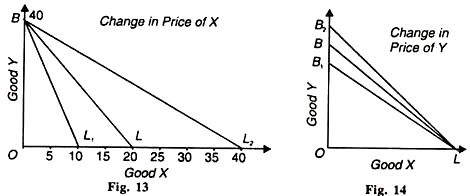
Take Figure 14 given the consumer’s income and price of X being constant, with a fall in the price of Y his budget line LB will rotate outwards from point L t LBr This is because he buys more quantity of Y than before with the fall in its price. Conversely, with the increase in its price, his price income line LB will rotate to LB because he purchases less quantity of Y than before.

Change in Income:
The prices of X and Y remaining constant, if the consumer’s income or budget increases or decreases, his income or budget line will also change. If income increases, the budget line will shift outwards as shown in Figure 15 where the BL line shifts to В2L2.
On the other hand, if income falls, BL line will shift inwards to B1L1 Note that prices of goods X and Y being constant, there is no change in the slope of the budget line. There is a parallel inward or outward shift of the budget line. 