The below mentioned article provides an overview on the Income Effect of the Consumer.
Given the tastes and preferences of the consumer and the prices of the two goods, if the income of the consumer changes, the effect it will have on his purchases is known as the income Effect.
If the income of the consumer increases his budget line will shift upward to the right, parallel to the original budget line. On the contrary, a fall in his income will shift the budget line inward to the left. The budget lines are parallel to each other because relative prices remain unchanged.
Normally, when the income of the consumer increases, he purchases larger quantities of two goods. In Figure 21 he buys RA of Y and OA of X at the equilibrium point R on the budget line PQ. As his income increases, he buys SB of Y and OB of X at the equilibrium point S on Px Qx budget line and still more of the two goods TC of Y and ОС of X, on the budget line P2Q2.
ADVERTISEMENTS:
Usually, the income consumption curve slopes upwards to the right as shown in Figure 21. But an income-consumption curve can have any shape provided it does not intersect an indifference curve more than once. We can have five types of income consumption curves.
The first type is explained above in Figure 21 where the ICC curve has a positive slope throughout its range. Here the income effect is also positive and both X and Y is normal goods.
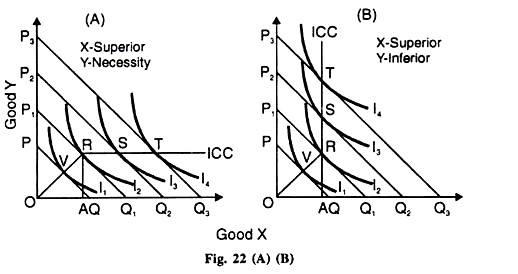
The second type of ICC curve may have a positive slope in the beginning but become and stay horizontal beyond a certain point when the income of the consumer continues to increase. In Figure 22 (A) the ICC curve slopes upwards with the increase in income up to the equilibrium point R at the budget line P1Q1 on the indifference curve 1.
ADVERTISEMENTS:
Beyond this point it becomes horizontal which signifies that the consumer has reached the saturation point with regard to the consumption of good Y.
He buys the same amount of Y (RA) as before despite further increases in his income. It often happens in the case of a necessity (like salt) whose demand remains the same even when the income of the consumer continues to increase further. Here Y is a necessity.
Figure 22 (B) shows a vertical income consumption curve when the consumption of good X reaches the saturation level R on the part of the consumer. He has no inclination to increase its purchases despite further increases in his income. He continues to purchase OA of it even at higher income levels. Thus X is a necessity here.
ADVERTISEMENTS:
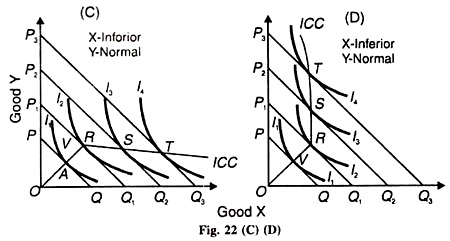
The last two types of income consumption curves relate to inferior goods. The demand of inferior goods falls, when the income of the consumer increases beyond a certain level, and he replaces them by superior substitutes. He may replace coarse grains by wheat or rice, and coarse cloth by a fine variety. In Figure 22 (C), good Y is inferior and X is a superior or luxury good.
Up to point R the ICC curve has a positive slope and beyond that it is negatively inclined. The consumer’s purchases of Y fall with the increase in his income. Similarly in Figure 22 (D), good X is shown as inferior and У is a superior good beyond the equilibrium point R when the ICC curve turns back upon itself. In both these cases the income effect is negative beyond point R on the income-consumption curve ICC.’
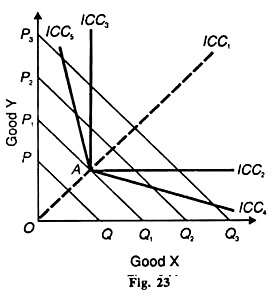
The different types of income-consumption curves are also shown in Figure 23 where:
(1) ICC1 Alternative Method, has a positive slope and relates to normal goods;
(2) ICC2 is horizontal from point A, X is a normal good while У is a necessity of which Fig. 23 the consumer does not want to have more than the usual quantity as his income increases further.
(3) ICC1is vertical from A, Y is a normal good here and X is satiated necessity;
(4) ICC4 is negatively inclined downwards, У becomes an inferior good form A onwards and X is a superior good; and
(5) IСС5, shows X as an inferior good and У as a superior good.
ADVERTISEMENTS:
The Engel Curve:
The Engel curve, of a good which the consumer will purchase at various levels of income, given his named after a 19th century German statistician, Ernest Engel, shows the quantities tastes, preferences and the price of the good in question.
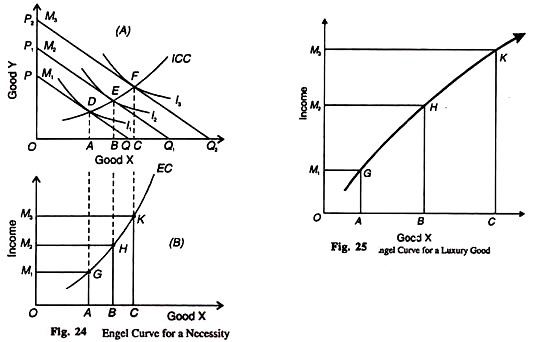
The income consumption curve ICC which represents the quantities of goods X and Y that would be purchased by a consumer at various levels of income. The ICC can be used to derive on Engel Curve. Let us derive an Engel curve for good X from the ICC of Figure 20 (A).
ADVERTISEMENTS:
The ICC shows that with the increase in the income of the consumer form M1, to M2, and to M3 the quantities of X purchased by him increase from OA to OB and to ОС, given the prices of X and Y. In panel (B), the income of the consumer is taken on the vertical axis and the quantities of X purchased on the horizontal axis.
Now we transfer the various combinations of income and quantities of X purchased in the lower diagram. We trace from the upper diagram point G representing income M1, and OA quantity of X; point H representing income M2 and OB quantity of X; and point K, representing income M3 and ОС quantity of X. By joining these points G, H and K, we draw an upward sloping Engel curve EC. Which shows that as the income of the consumer increases, he buys more of good X.?
This Engel curve relates to a necessity good X whose quantity purchased increases at a diminish rate as the income of the consumer rises. Initially, he buys OA of good X with OM1 income. As his income rises to OM2 he buys more quantity AB of X which is less than OA. With further increase in his income to OM3 he buys BC more of X which is less than AB. But in the case of a luxury, the quantity of X purchased increases at an increasing rate with the increase in income, as shown in Figure 25 where OA < OB < ОС.
Necessities and luxuries taken together refer to normal goods in whose case the Engel curve is upward sloping from left to right because as income increases the consumer purchases more of X. If good X happens to be an inferior good, the consumer purchases less quantity of X as income increases.
ADVERTISEMENTS:
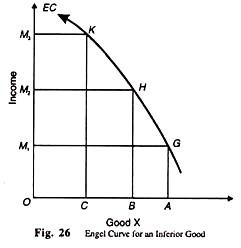
An Engel curve for the inferior good X is shown in Figure 26 where the quantity purchased of X falls from OA to OB and to ОС when his income increases from OM1 to OM2 and OM3 respectively. Such an Engel curve slopes backward form right to left, as shown by the EC curve in the figure.
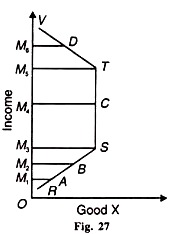
In the case of a neutral good such as salt which is consumed by everybody, the Engel curve is a vertical line as shown by the ST segment of the curve in Figure 27. With the increase in the income of the consumer, he consumes the same quantity of good X, i.e., M3S = M4C = M5T. This figure also shows that the RS segment of, the Engel curve relates to X as a necessity and TV segment to an inferior good.
