
Here is an essay on ‘India and Economic Growth’ for class 8, 9, 10, 11 and 12. Find paragraphs, long and short essays on ‘India and Economic Growth’ especially written for school and college students.
Essay on India and Economic Growth
Though it seems surprising but it is a fact now that after Japanese Miracle, East Asian Miracle and Chinese Miracle there has been now India’s growth miracle, as in the last 15 years (2000 to 2015) India achieved on an average annual growth rate of around 7.3 per cent while China’s average annual growth rate during these fifteen years has been around 10 per cent. More surprisingly, in the four successive years (2004-2008), India achieved average annual growth rate of 9 per cent. Further, in the Eleventh Plan period (2007-12) there has been average annual GDP growth rate of 8 per cent which is the highest achieved in any Indian plan.
It is due to this high rate of GDP growth rate that, according to a World Bank’s International Comparison Program (ICD) report, in 2011 India displaced Japan to become the world’s third biggest economy in terms of GDP (based on purchasing power parity prices) ranked after the U.S. and China. India’s miraculous growth in recent years can be seen from the fact that the previous International Comparison Program (ICP) survey report for the year 2005 had placed India in terms of GDP (at PPP prices) in the 10th place. So between 2005 and 2011 due to higher GDP growth rate India jumped from 10th place to the 3rd place in respect of GDP (at PPP prices).
India’s share in World GDP in terms of PPP was 6.4% in 2011 compared with China’s 14.9 per cent and the U.S. 17.1 per cent, the latest ICP survey showed. The survey covered 199 countries. In 2011 ranking, India’s economy was 37.1 per cent of the U.S. economy compared to 18.9 per cent in 2005. It may be noted that purchasing power parity (PPP) prices are used to compare economies and incomes of the people by adjusting for differences in prices in different countries to make a meaningful comparison. However, it is worthwhile to mention that due to large population, in respect of per capita GDP, even in PPP terms, India’s rank in 2011 was placed at 127 in the 199 country ranking while China’s rank was placed at 99 compared to 12th rank of the U.S.
ADVERTISEMENTS:
India’s Growth Miracle:
Since 2003 Indian economy has emerged as one of the fastest growing economies of the world. In fact, next to China, India’s growth rate from 2003-04 to 2014-15 has been highest in the world. This is often referred to as India’s growth miracle. Before 1980s India’s average growth rate stuck at around 3.6 per cent per annum which Late Prof. Raj Krishna called Hindu rate of growth. In the nineteen eighties India’s average rate of economic growth rose to 5.6 per cent per annum and further in the 1990s and up till 2002-03 (i.e., in 12 years period), India’s average growth rate went up to 6.2% per annum under liberalisation and globalisation of the Indian economy.
But from 2004-05 to 2007-08 India’s average annual growth rate of GDP rose to over 9 per cent per annum. In 2008-09 while the advanced developed countries were experiencing recession (i.e., negative growth), India succeeded in achieving 6.7 per cent growth rate which further rose to 8.6% in 2009-10 and 8.9% in 2010-11.
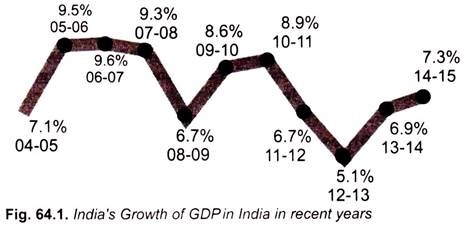
It will be seen from Table 64.1 (last row) that the GDP growth rate at factor cost (at 2004-05 prices) picked up from the year 2003-04. As compared to average GDP growth rate of around 6.2 per cent in 1991-2003, it was estimated at 8 per cent in 2003-04, 7.1 per cent in 2004-05, 9.5 per cent in 2005-06, 9.6 per cent in 2006-07, and 9.3 per cent in 2007-08. In the year of global financial crisis, it fell to 6.7 per cent in 2008-09. But even then it was well above other countries except China.
ADVERTISEMENTS:
The GDP growth rate again rose to 8.6 per cent in 2009-10 and to 8.9 per cent in 2010-11. In the next two years, 2011-12 and 2012-13 there was temporary slowdown in economic growth but in those two years due to adverse global factors, the growth rate declined in all countries including China. However, from 2013-14 onwards, India’s growth rate has picked up while GDP growth rates in other countries of the world remain at lower levels. India’s GDP growth rate has raised to 6.9 per cent in 2013-14 and to 7.3 per cent in 2014-15 and it is estimated to up to 7.6 to 7.8 per cent in 2015-16. With this India which has been the second fastest growing economy of the world since 2003 next only to China will overtake China in 2015-16 and is expected to become the fastest growing economy of the World. India’s growth rate since 2004-05 is depicted in Fig. 64.1.
Now, the question is how we account for such a high growth rate in GDP from 2003- 04 to 2014-15 in India. Growth depends mainly on rate of saving and investment (or, in other words, on rate of capital formation), and improvement in technology or capital-output ratio. In India, such as in other emerging economies, China, Singapore, Indonesia and South Korea, it was mainly increase in rate of saving and investment (i.e., rate of capital formation) that brought about a sharp growth in GDP Rates of gross domestic saving and capital formation and GDP growth since 2002-03 are given in Table 64.1.
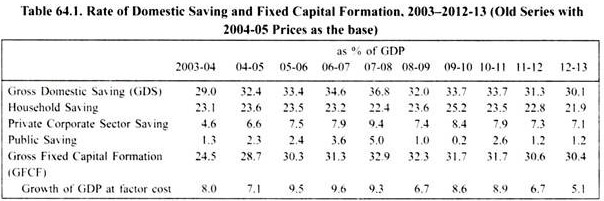
Prior to 2003-04 rate of gross domestic saving in India was around 24 to 26% of GDP. But, as will be seen from Table 64.1, from 2004- 05 to 2007-08 (that is, prior to global financial crisis) domestic saving rate rose to 36.8 per cent of GDP in 2007-08 which pulled up the rate of investment or capital formation. As a result, average growth rate of GDP for the four years period (2004-08) rose to over 9 per cent. With this India became the second fastest growing economy of the world next only to China.
ADVERTISEMENTS:
In keeping with the higher saving rate from 2003-04 onwards, rate of fixed capital formation (GFCF) rose from 24.1 per cent in 2003-04 to about 33 per cent of GDP in 2007-08 (5th row in Table 64.1). This higher growth rate of fixed capital formation caused 9 per cent plus average growth in GDP during 2004-05 to 2007-08. In 2008-09 global financial crisis (2007-09) and consequently global meltdown caused a fall in saving rate to 32.0% of GDP in 2008-09 but it rose again to 33.7% in both 2009-10 and 2010-11 before falling to 30.1% of GDP in 2011-12.
The substantial increase in consumption expenditure under the fiscal stimulus measures to keep the growth momentum which caused drop in public saving rate to 1.0 per cent of GDP in 2008-09 as compared to 5.0 per cent in 2007-08. This financial crisis which caused negative growth of India’s exports in 2008-09 slowed down the rate of economic growth in 2008-09 to 6.7 per cent. However, while advanced developed countries of the U.S., Japan and Europe experienced worst ever recession since the Great Depression of 1930s, India was successful in attaining the growth rate of 6.7 per cent in 2008-09. With the saving rate going up to 33.7 per cent and gross capital formation rate to 36.5 per cent of GDP in 2009-10 and revival of positive growth in exports in the second half of 2009-10, rate of growth of GDP rose to 8.6 % in 2009-10.
In 2010-11 also with domestic saving rate equal to 33.7 per cent which along with capital inflows raised gross capital formation to around 36.5 per cent and, as a result, rate of GDP growth rose to 8.9 per cent in 2010-11 (RE). However, for the reasons explained below in 2011-12, growth rate of GDP fell further to 6.7 per cent, lowest in nine years. In 2012-13 growth rate in GDP fell further to 5.1 per cent but GDP growth rate picked up to 7.3 per cent in 2014-15.
The macroeconomic situation in India in 2013-14 and 2014-15 improved significantly. The release of the new series of national income accounts with 2011-12 as the base year revealed that the economy has been performing much better than what was thought earlier. In the face of sluggish global demand conditions, it is the increase in domestic demand that brought about the increase in GDP growth. In 2013-14 growth of GDP at constant 2011-12 market prices picked up to 6.9 per cent in 2013-14 and further to 7.3 per cent in 2014-15 (revised estimates).
Most of the buoyancy in domestic demand can be traced to increase in consumption expenditure, especially by the Government. Whereas private final consumption expenditure at constant market prices increased by 6.2 per cent in 2013-14, 7.1 per cent in 2014-15, Government final consumption expenditure increased by 8.2 per cent in 2013-14 and 10.0 per cent in 2014-15.
Reasons for Substantial Rise in Saving Rate:
Now, what has caused saving rate in India to rise substantially since 2004? Components of saving rate are – (1) household savings, (2) private corporate sector saving and (3) public saving. It will be seen from Table 64.1 that while household savings had stuck at around 23.5 per cent of GDP from 2002-03 to 2011-12 and therefore it cannot explain remarkable rise in overall saving rate in the Indian economy since 2004. It is the private corporate sector which registered a substantial rise in saving rate from 4.1 per cent of GDP in 2002-03 to 9.4 per cent of GDP in 2007-08, that is, the private corporate sector saving more than doubled in the five-year period.
After dipping to 7.4 per cent of GDP in 2008-09, the year of global crisis, private sector saving again rose to 8.4 per cent of GDP in 2009-10 and around 8 per cent of GDP in 2010-11. It is this significant increase in corporate sector saving that resulted in higher rate of fixed capital formation which contributed to a big jump in annual growth rate to over 8 per cent in these years.
ADVERTISEMENTS:
Besides, large increase in public saving since 2003 also contributed a lot to the increase in the overall saving rate and capital formation from 2003-04 to 2007-08. After 2007-08 due to fiscal stimulus, public saving and its contribution to capital formation or investment declined in the Indian economy. The public sector saving which was negative prior to 2003-04 turned positive and rose to 5 per cent of GDP in 2007-08.
Thus private corporate sector and public savings together increased by around 10 per cent of GDP from 2003-04 to 2007-08, which brought about higher rate of overall saving and capital formation and ensured higher rate of economic growth. It will be seen from Table 64.1 that fixed capital formation which was 24.1 % of GDP in 2002-03 rose to about 33% of GDP in 2007-08. No wonder that with such a high rise in fixed capital formation the average growth rate of GDP during the period 2004-08 rose to over 9%.
How do we explain the large increase in saving of the private corporate sector? It is primarily due to the increase in profitability of private corporate sector as measured by the ratio of profit after tax (PAT) to sales, which rose from 3.6% to 8% in the six years period, 2003-09. Besides the rise in profitability of the private corporate sector, the companies also reduced dividend rate from half of profits to 1/4th of them. That is, the corporate companies retained (i.e., saved) a greater amount of profits for their expansion or capital formation. Thus, the profits of the private corporate sector not only increased faster on account of higher economic growth but also the companies distributed less of them as dividends that resulted in substantial increase of corporate sector saving.
As regards the public savings, they rose from negative rate in 2003-04 to 5 per cent of GDP in 2007-08. It occurred due to increase in tax revenue, especially from the corporate sector. Thus, revenue from corporate tax rose from 1.9 per cent of GDP to 3.6 per cent during this period. Indeed, as a result of it since 2004 overall tax-GDP ratio rose from 8.9 per cent in 2003-04 to 11.9 per cent in 2007-08.
ADVERTISEMENTS:
This better tax performance along with Government control of its public expenditure under the Fiscal Responsibility Budget Management (FRBM) Act resulted in the fall in Central government’s fiscal deficit to 2.5 per cent of GDP in 2007-08. Thus, the improved performance of both the private corporate sector and the public sector in the liberalisation era, especially during the period from 2003-04 to 2007-08, became the significant driver of faster economic growth of the Indian economy.
It may be further noted that rapid growth of some new sectors such as Telecom and IT which hardly existed before 2000 contributed a good deal too rapid economic growth since 2004. Besides, low interest rate policy of the Reserve Bank of India until 2008 made borrowing from the banks cheaper which created large demand for consumer durables such as cars, electronics and housing. This ensured relatively higher growth of consumer durables since 2003-04.
Temporary Slowdown in the Growth of the Indian Economy in 2011-12 and 2012-13:
It may be noted that situation regarding saving in the two years (2011-12 and 2012-13) deteriorated, which adversely affected its potential growth rate. Saving as per cent of GDP fell to 31.3 in 2011-12 as against 36.8 per cent in the year 2007-08 (according to old series). This slowdown in saving rate prevented the Indian economy to grow at a faster pace. As explained above, high saving rate had allowed India to domestically finance a major part of its investment and slowdown in saving rate lowered the potential growth rate.
ADVERTISEMENTS:
It may be noted that due to slowdown in savings in recent years has been seen in all three segments, household saving, private corporate saving and public saving (Table 64.1). The fall in household savings has been due to high inflation. Because of high inflation the households had to spend more on consumer goods to maintain their usual standard of living which resulted in reduction of their savings. Besides, high inflation caused the real rate of interest earned on investment in bank deposits and other forms of financial savings that brought down the financial savings of the households who instead used their savings to buy gold, silver, real estate as hedge against inflation. This adversely affected productive investment.
It is worth mentioning that due to the poor recovery in the U.S. and European countries and uncertainty caused by Eurozone sovereign debt crisis, it was difficult to get sustained capital inflows to finance investment during the period, 2011-13. It was therefore necessary to increase domestic saving to finance increase in investment for attaining higher rate of economic growth.
Because in India at times of global recession in 2008-09 there was fiscal and monetary space, timely stimulus allowed the economy to recover fairly quickly to a growth of 8.6 per cent in 2009-10 and 8.9 per cent in 2010-11 (revised estimates). Since then a number of factors, both global and domestic, have led to a slowdown of the Indian economy. The slowdown in the Indian economy began in the second quarter of 2011 -12 when the growth rate fell to 6.7 per cent from a level of 8.0 per cent in the first quarter and continued in the subsequent quarters. From the quarters 4 of 2011-12 and quarters 1 and 2 of 2012-13, growth had been in the range of 5.3 to 5.5 per cent. In the whole year 2011-12 the growth rate of GDP at factor cost was 6.7 per cent as against 8.6 per cent in 2009-10 and 8.9% in 2010-11 (revised estimates) but dropped to 5.1 per cent in 2012-13, the lowest in the ten years.
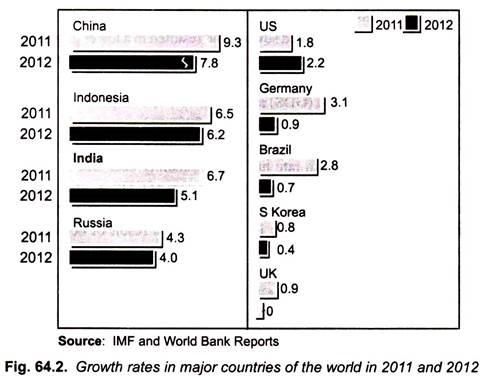
It may however be noted that slowdown in economic growth was not confined to India alone during this period. There had been a general slowdown in the global economy which was passing through a rather prolonged phase of uncertainty. The recovery from the global crisis of 2008-09 in the advanced economies had been slow and uneven, and a decisive resolution of sovereign debt problem of the Eurozone area had yet to be achieved. Having achieved a GDP growth of 5.1 per cent in 2010, the rate of growth in the global economy declined to 3.8 per cent in 2011 and further declined to 3.3 per cent in 2012, as per the World Economic Outlook released by the IMF in October 2012.
The rate of growth of developed economies declined from 3.0 per cent in 2010 to 1.6 per cent in 2011 and was expected to decline further to 1.3 per cent in 2012. Even the emerging economies had slowed down during this period, partly as a result of the slowdown in their export markets. China’s growth declined from 10.4 per cent in 2010 to 9.3 per cent in 2011 and was expected to be 7.8 per cent in 2012. Brazil’s growth dipped from 7.5 per cent in 2010 to 2.8 per cent in 2011 and was expected to be 0.7 per cent in 2012 as shown in Fig. 64.2.
ADVERTISEMENTS:
Slowdown in India’s economic growth began in the second quarter of 2011-12 but the slowdown had been sharper in 2012-13. Whereas growth rate in the whole year 2011- 12 fell to 6.7 per cent as against 8.6 per cent in 2009-10 and 8.9% in 2010-11, the growth rate in 2012- 13 fell to 5.1 per cent. What accounts for this recent slowdown in India’s economic growth rate?
The slowdown in growth rate in India in 2011-12 and 2012-13 can be explained in terms of both global factors and domestic factors. First, the slowdown in growth in developed economies and near recessionary conditions in Europe resulted not only in lower growth of international trade but also lower capital inflows. As a result, the growth rate of India’s exports declined which contributed to the decline in overall growth rate and also caused problem of current account deficit (CAD). Besides, fall in capital inflows not only resulted in lower investment in the Indian economy but also made the problem of financing current account deficit (CAD) difficult.
Further, international price of crude oil remained high which led to the increase in fuel subsidy bill of the Indian government and drained away resources from public investment. This also adversely affected economic growth. Besides, high crude oil prices led to the widening of India’s trade and current account deficits which caused sharp depreciation of rupee which adversely affected the sentiments of foreign investors.
Turning to the domestic factors, higher borrowing costs for the corporate sector due to RBI’s high repro rate, the rate at which Reserve Bank lends to the commercial banks, discouraged investment by the corporate sector harming economic growth. The Reserve Bank of India continued to follow a relatively tight monetary policy to control inflation although there was some relaxation by it in lowering cash reserve ratio (CRR) and reducing repo rate by 0.50 per cent in April 2012 and 0.25 per cent in the end of January 2013.
As a result of this tight monetary policy of RBI, the cost of borrowing remained at an elevated level and this had an impact on investment and growth in the Indian economy, particularly that of the industrial sector. The erratic power supply due to coal shortage caused delays in implementation of investment projects which made their financing more difficult and investors more cautious. Difficulties in getting clearances of various investment projects also resulted in lower investment. Further, various scams and corruption charges against several ministers and bureaucrats caused policy paralysis which made investors hesitant to make investment.
Besides, rainfall in the monsoon season of 2012-13 had been below normal particularly in the key months of June and July, 2012. This affected sowing and resulted in a lower growth rate of agriculture and allied sectors. But the most important factor causing fall in growth rate as seen above has been fall in saving and investment rates both by the public and private sectors. Worrisome for the economy’s long- term growth rate gross domestic saving (GDS) rate fell sharply to 31.3 per cent of GDP in 2011 -12 and further to 30.1 per cent in 2012-13 (which is lowest since 2005-06) as against 33.9 per cent in 2011 -12.
ADVERTISEMENTS:
Savings declined in all three segments, namely, households, private corporate sector and government (i.e., public sector). The slower growth rate in GDS has mainly been due to decline in household financial saving from 12.9% of GDP in 2009-10 to 8 per cent of GDP in 2011-12, private corporate saving sector from 8.4% of GDP in 2009-10 to 7.3% in 2011-12 and that of public sector saving from 2.6 per cent in 2010-11 to 1.2 per cent in 2011-12.
As a result of decline in gross domestic saving, gross fixed capital formation (as % of GDP) fell from 33 per cent in 2007-08 to 31.7 per cent in 2010-11, to 31.8 per cent in 2011-12 and further to 30.6 per cent in 2011-12 and 30.4 per cent of GDP in 2012-13. No wonder that growth in GDP fell sharply to 6.7 per cent in 2011-12 and to 5.1 per cent in 2012-13 (the lowest in nine years) from 8.9 per cent in 2010-11 (as per revised estimates).
Revival of Growth:
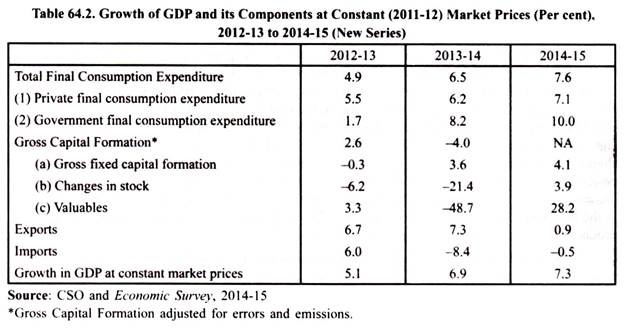
Growth in GDP at constant market prices and of its components for three years 2012-13, 2013-14 and 2014-15 according to new series (2011-12 as the base) is given in Table 64.2. It will be seen from this table that in 2013-14 and 2014-15 the growth of GDP has picked up; it is 6.9 per cent in 2013-14 and 7.3 per cent in 2014-15. In 2015-16, it is estimated that GDP growth will rise to around 7.8%. It will be further seen that there has been increasing trend in final consumption expenditure, with both private and government consumption expenditure growing in strength. Secondly, the fixed capital formation which is crucial for revival of economic growth has also picked up; it grew at 3.6 per cent in 2013-14 and 4.1 per cent in 2014-15 as against its negative growth in 2012-13.
ADVERTISEMENTS:
Thirdly, there is hardly any support to growth from exports in 2014-15. Exports grew only 0.9 per cent in 2014-15 as against 6.7 per cent in 2012-13 and 7.3 per cent in 2013-14. There has been deceleration in imports in 2013-14 and 2014-15 as well which is substantially due to sharp decline in international oil prices in 2014-15 that has reduced our oil import bill. Thus, it can be said that growth revival in 2013-14 and 2014-15 is mainly driven by domestic consumption and fixed capital formation.
India Emerging as the Fastest Growing Economy of the World:
India’s growth story is expected to dominate the headlines in the years to come as both the World Bank and the IMF predicting that from 1915-16 onward India will overtake China to become the fastest growing economy of the world. The World Bank in its report has estimated that India would achieve 7.5 per cent growth in 2015-16 while China’s growth will be around 6.8 per cent to 7 per cent. Further, according to World Bank forecasts, India’s growth rate will accelerate to 7.9 per cent in 2016 and to 8 per cent in 2017.
The Economic Survey 2014-15 estimates that India’s GDP growth at market prices will be 8.1 to 8.5 per cent in 1915-16. The RBI’s forecast for the year 2015-16 is 7.8 per cent. Economic indicators have shown signs of green shoots and policy makers expect that the momentum to sustained growth on the back of reforms that unfold in the years ahead. According to World Bank, acceleration in GDP growth will be driven by higher investment which is expected to grow at an average rate of 12% during 2015-2017. In our view with around 31.0% as the present (2014-15) saving rate and with capital inflow of around 2 per cent investment or capital formation will be around 33 per cent. With capital-output ratio estimated to be equal to 4, the growth rate of 8 per cent is quite feasible.
The achievement of 8 per cent growth rate is warranted by four factors. Higher rate of investment or capital formation made possible by increase in domestic saving and normal capital inflow of around 2% of GDP will help in achieving 8 per cent growth rate in the short run to medium term. Second, the Indian government has taken a number of economic reforms and is planning several more which has boosted investment sentiments of both the domestic and foreign investors. This is expected to have a positive impact on economic growth. Besides, investment proposals by investors are getting quick clearance by the government.
Third, an important factor that will boost growth will be provided by declining oil prices and increasing monetary easing by RBI made possible by fall in inflation rate. Decline in oil prices will reduce substantially the government expenditure on subsidies and thus releasing funds for investment. Stimulating the effects of tax cuts made in the budgets for 2014-15 and 2015-16, declining oil prices will add to spending power of households, thereby boosting consumption and growth. Oil is also a significant input in production and its declining prices will shore up profit margins and hence balance sheets of the corporate sector.
ADVERTISEMENTS:
Similarly, IMF says, “Growth in India will benefit from recent policy reforms, a consequent pick-up in investment and lower oil prices will raise real disposable incomes particularly among poor households.” IMF report further says that inflationary pressures in the Indian economy are likely to ease gradually on account of lower credit prices and improved production capacity will prevent overheating in the medium term.
A few years ago no one had imagined that India would overtake countries like China, Japan, and South Korea to become the fastest growing economy of the world. Till now China has been the fastest growing economy of the world. Now, both World Bank and IMF have estimated that beginning from the year 2015 (2015-16), India will overtake China and become the fastest growing economy of the World. In 2014 China’s GDP grew at 7.4 per cent while India’s GDP growth rate was 7.3 per cent. But China’s growth rate is estimated to slip to 7.1 per cent in 1915, to 7.0 per cent in 2016 and further to 6.9 per cent in 2017.
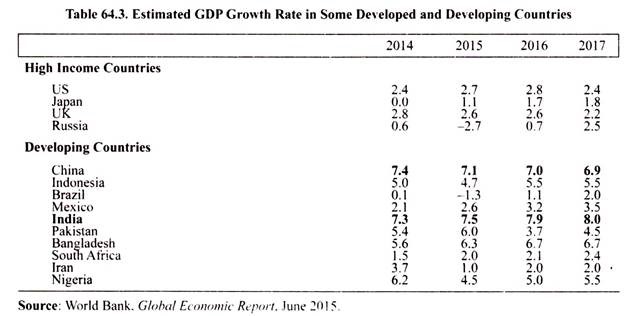
On the other hand, India’s growth rate will rise to 7.5 per cent in 2015, to 7.9 per cent in 2016 and further to 8.0 per cent in 2017 (Table 64.3) that growth rate in High Income Countries such as US, UK, Japan, Soviet Russia is far behind that of India. The same is the case of growth rate in Indonesia, Brazil, Mexico, and South Africa which is much less than that of India.
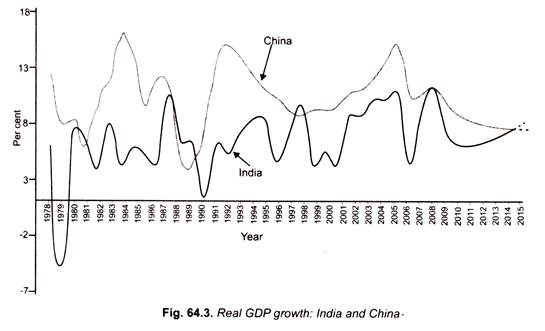
India’s Economic Survey 2014-15 has provided a graph given below comparing the growth rate of India and China. With the exception of few years, China’s growth rate has been much higher since 1998 but from 2015 onwards India’s growth will go above that of China.
Revised Growth Forecast by IMF:
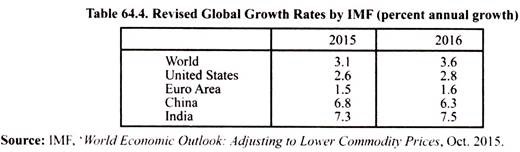
It may be noted that in its latest October 2015 report “World Economic Outlook Update” IMF has revised its growth forecast for the world and for both developed and developing countries. As shown in Table 64.4, according to these revised growth forecasts by IMF, India is likely to grow at 7.3 per cent in 2015, marginally lower than 7.5 per cent in its earlier estimates, and 7.5 per cent in 2016 as against its earlier estimate of 7.8 per cent in 2016.
However, despite the marginally lower growth forecast of India by IMF, India will remain the world’s fastest growing economy outpacing China’s revised growth rate of 6.8 per cent in 2015, where recent shocks have sent ripples across the world. According to IMF, in India Growth will benefit from recent policy reforms, which is a consequent pick-up in investment and lower commodity prices. Besides, according to it, domestic demand in India is projected to remain strong.
Furthermore, IMF report says “With China transitioning into an environment of lower growth, India could durably occupy the top growth spot among large emerging economies”. However, it adds “in an environment of declining commodity prices, reduced capital flows to emerging markets and pressure on their currencies, and increasing financial market volatility, downside risks to the outlook have raised, particularly for emerging markets and developing economies.”
It is evident from above that achievement of high GDP growth rates by India is quite extraordinary but more so because, unlike China, they have been achieved in a framework of parliamentary democracy with people enjoying fundamental rights to life, liberty and ownership of property. Laws regarding regulating the economy and government interventions in crucial fields have to be passed through Parliament where they are healthy debated.
Therefore, to achieve 8 to 9 per cent GDP growth rate is no less than a miracle. If this growth momentum is maintained in future and advantage of demographic dividend is availed of by imparting appropriate skills to the growing labour force and providing them gainful employment, then India will catch up soon with the advanced developed countries.
Is GDP Growth enough for Raising Living Standards of the People?
It is explained above that India’s performance in terms of GDP growth has been quite good which has made possible for it to overtake China in this regard and has emerged as the fastest growing economy of the world from 2015-16 onwards. However, a pertinent question is whether GDP growth is enough for raising the standards of living of the people, especially bottom 40 per cent of population. It may be noted that in developing countries like India mere GDP growth in itself is not enough; it is meaningful if it uplifts the poor living below the poverty line and generate gainful employment opportunities for the unemployed.
Besides GDP growth, it is required to fulfill the basic needs of the people, namely food security, good nutrition; healthcare and education which builds human capital and without it even growth cannot be sustained. It is for this reason that the Twelfth Five Year Plan pointed out that growth should not only be faster but also sustainable and inclusive. By inclusive growth we mean that benefits of growth must reach the poor and other marginalised sections of the society.