The following article will guide you about how the price of commodity is determined by the interaction between demand for and supply of it.
The theory of demand and supply, first developed by Alfred Marshall in 1890, shows how consumer preferences determine consumer demand for commodities, while business costs are the foundation of the supply of commodities. If we see fall in the price of rice, for instance, it is either because the demand for rice has gone down or because the supply of rice has gone up. The same is true for every market, from wheat to mangoes: changes in supply and demand lead to changes in output and prices.
In fact, the market price of a commodity is determined (or reaches its competitive equilibrium) where the demand curve and the supply curve intersect — where the forces of demand and supply (also known as the impersonal market forces) are just in balance.
As Paul Samuelson has rightly commented:
ADVERTISEMENTS:
“It is the movement of price mechanism, which brings supply and demand into balance or equilibrium.”
The Demand Curve:
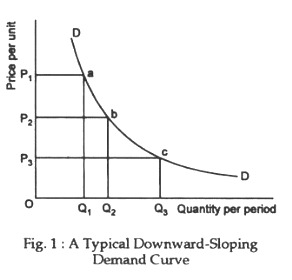
In a market-based economy the quantity of a commodity people buy depends on its price. The higher the price of a commodity, all other things remaining unchanged, the fewer units consumers are willing to buy. The lower its price, the more units of it are purchased. This definite relationship = between the market price of a commodity and the quantity demanded of the same, ceteris paribus, is called the demand schedule, or the demand curve.
From this emerges one famous law of economics, viz., the law of downward sloping demand. The law can be stated as follows: when the price of a commodity. Similarly, when the price is reduced, ceteris paribus, quantity demanded increases. Fig. 1 shows a downward sloping demand curve which relates quantity demanded to price. The negative slope of the demand curve illustrates the law of downward-sloping demand.
The demand curve is downward sloping due to substitution effect and income effect. The market demand curve for a commodity is arrived at by adding up the demand curves of individual consumers.
The Supply Curve:
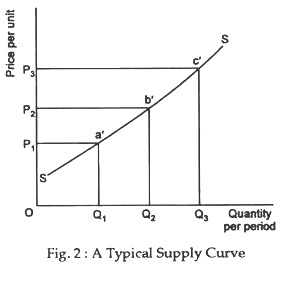
The supply side of a market typically shows the behaviour of producers—the decisions they take to produce and sell their products. To be more specific, the supply schedule relates the quantity supplied of a commodity to its market price, holding equal other things such as costs of production, the prices of related goods and government policies.
In short, the supply schedule (and supply curve) for a commodity shows the relationship between its market price and the amount of that commodity that producers are willing to produce and sell, ceteris paribus.
ADVERTISEMENTS:
Fig. 2 shows a typical supply curve which relates quantity supplied to price. Supply depends on cost of production or, more specifically, on marginal cost (which is the extra cost of producing one extra unit). So long as marginal cost is less than price, a business firm will find it profitable to supply additional units. In fact, producers supply commodities for profit.
As Paul Samuelson has rightly commented:
“When production costs for a good are low relative to the market price, it is profitable to supply a great deal, when production costs are high relative to price, firms produce little, switch to the production of other products, or may simply go out business.”
Determinants of Cost:
Two major factors affect production costs, viz.:
(i) The prices of inputs such as labour, energy, or machinery exert considerable influence on the cost of producing a given level of output,
(ii) Another important determinant of production cost is technological advances, which consist of changes that reduce the quantity of inputs needed to produce the same amount of output.
Three other factors affecting supply are: government policy (such as environmental regulation), market structure (whether there is perfect competition and monopoly) and expectations about future prices.
ADVERTISEMENTS:
Equilibrium of Demand and Supply:
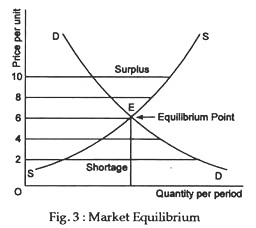
Demand and supply interact to ensure an equilibrium price and quantity, or a market equilibrium. The market equilibrium occurs at that price and quantity where the forces of supply and demand are in balance.
As Samuelson has rightly put it:
“At the equilibrium price, the amount that buyers want to buy is just equal to the amount that sellers want to sell. The reason why we call this an equilibrium is that, when supply and demand are in balance, there is no reason for price to rise or fall, as long as other things remain unchanged.”
ADVERTISEMENTS:
See Table 1.
The table shows that only at a particular price, viz., the equilibrium price (Rs. 6 per kg.) the desires of buyers and sellers are simultaneously satisfied. There is no unsatisfied seller and there is no unsatisfied buyer either. At all other prices there is either excess supply (surplus) or excess demand (shortage). See Fig. 3 which is self-explanatory.
ADVERTISEMENTS:
It shows that market equilibrium occurs at the intersection of supply and demand curves. To conclude, however, “the equilibrium price and quantity comes at that level where the amount willingly supplied equals the amount willingly demanded. In a competitive market, the equilibrium is found at the intersection of the supply curve and the demand curve. There is no shortage or surplus at the equilibrium price.”


