It is useful to know what economists mean by the demand for the goods by consumers. The demand for a commodity is essentially consumer’s attitude and reaction towards that commodity.
Contents:
- Meaning of Demand
- Demand and Utility
- Law of Demand
- Market Demand Function
- Extension and Contraction in Demand
- Factors Determining Market Demand
- Shifts in Demand: Increase and Decrease in Demand
1. The Meaning of Demand:
It is useful to know what economists mean by the demand for the goods by consumers. The demand for a commodity is essentially consumer’s attitude and reaction towards that commodity. Demand for a good is in fact a photograph or a panoramic picture of consumers attitude towards a commodity. This consumers’ attitude gives rise to actions in purchasing a certain number of units of a commodity at various given prices.
Precisely stated, the demand for a commodity is the amount of it that a consumer will purchase or will be ready to take off from the market at various given prices during a specified time period. This time period may be a day, a week, a month, a year or any given time period.
ADVERTISEMENTS:
This demand in economics implies both the desire to purchase and the ability to pay for a good. It is noteworthy that mere desire for a commodity does not constitute demand for it, if it is not backed by the ability to pay. For example, if a poor man who hardly makes both ends meet wishes to have a car, his wish or desire for a car will not constitute the demand for the car because he cannot afford to pay for it, that is, he has no purchasing power to make his wish or desire effective in the market.
Thus, in economics unless demand is backed by purchasing power or ability to pay it does not constitute demand. Demand for a good is determined by several factors, such as price of a commodity, the tastes and desires of the consumer for a commodity, income of the consumer, the prices of related goods, substitutes or complements.
When there is a change in any of these factors, demand of the consumer for a good change, individual consumer’s demand and market demand for a good may be distinguished. Market demand for a good is the total sum of the demands of individual consumers, who purchase the commodity in the market.
2. Demand and Utility:
People demand goods because they satisfy the wants of the people. The utility means want-satisfying power of a commodity. It is also defined as property of the commodity which satisfies the wants of the consumers Utility of a good is the important determinant of demand of a consumer for the good. Individuals are considered as attempting to maximise their utility or satisfaction from the goods they buy for consumption.
ADVERTISEMENTS:
Consumers’ demand for consumer goods for their own satisfaction is called direct demand. Utility is a subjective entity and resides in the minds of men. Being subjective it varies with different persons, that is, different persons derive different amounts of utility from a given good. People know utility of goods by means of introspection.
The desire for a commodity by a person depends upon the utility he expects to obtain from it. The greater the utility he expects from a commodity, the greater his desire for that commodity. It should be noted that no question of ethics or morality is involved in the use of the word, ‘utility’ in economics.
The commodity may not be useful in the ordinary sense of the term even then it may provide utility to some people. For instance, alcohol may actually harm a person but it possesses utility for a person whose want it satisfies. Thus, the desire for alcohol may be considered immoral by some people but no such meaning is conveyed in the economic sense of the term. Thus, in economics the concept of utility is ethically neutral.
Consumer choice of goods he buys is a difficult task in a modern economic system as thousands of goods and services are available in the market. But the quantities of goods consumers buy are constrained by their income. Who would not like to buy Maruti Esteem, dine at Taj Hotel and live in good bungalow in South Delhi? It is income which constrains people to buy goods. Thus consumers face a constrained maximisation problem.
3. The Law of Demand:
ADVERTISEMENTS:
An Important information about demand is described by the law of demand. This law of demand expresses the functional relationship between price and commodity demanded. The law of demand or functional relationship between price and quantity demanded of a commodity is one of the best known and most important laws of economic theory.
According to the law of demand, other things being equal, if the price of a commodity falls, the quantity demanded of it will rise, and if the price of the commodity rises, its quantity demanded will decline. Thus, according to the law of demand, there is inverse relationship between price and quantity demanded, other things remaining the same.
These other things which are assumed to be constant are the tastes and preferences of the consumer, the income of the consumer, and the prices of related goods. If these other factors which determine demand also undergo a change, then the inverse price-demand relationship may not hold good. Thus, the constancy of these other things is an important qualification of the law of demand.
Demand Curve and the Law of Demand:
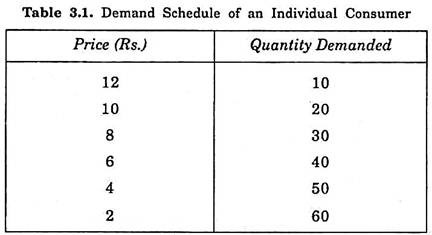
The law of demand can be illustrated through a demand schedule and through a demand curve. A demand schedule of an individual consumer is presented in Table 3.1. It will be seen from this demand schedule that when the price of a commodity is Rs. 12 per unit, the consumer purchases 10 units of the commodity. When the price of the commodity falls to Rs. 10, he purchases 20 units of the commodity.
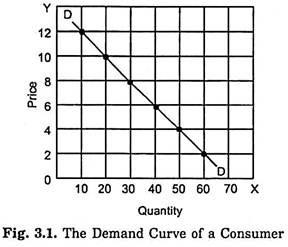
Similarly, when the price further falls, quantity demanded by him goes on rising until at price Rs. 2, the quantity demanded by him rises to 60 units. We can convert this demand schedule into a demand curve by graphically plotting the various price-quantity combinations, and this has been done in Fig. 3.1, where along the X-axis, quantity demanded is measured and along the Y-axis price of the commodity is measured.
By plotting 10 units of the commodity against price 12, we get a point in Fig. 3.1. Likewise, by plotting 20 units of the commodity demanded against price 10, we get another point in Fig. 3.1. Similarly, other points are plotted, representing other combinations of price and quantity demanded of the commodity presented in Table 3.1. By joining these various points, we get a curve DD, which is known as the demand curve. Thus, this demand curve is a graphic statement or presentation of quantities of a good which will be demanded by the consumer at various possible prices at a given moment of time.
It should be noted that a demand schedule or a demand curve does not tell us what the price is; it only tells us how much quantity of the good would be purchased by the consumer at various possible prices. Further, it will be seen both from the demand schedule and the demand curve that as the price of a commodity falls, more quantity of it is purchased or demanded. Since more is demanded at a lower price and less is demanded at a higher price, the demand curve slopes downward to the right.
ADVERTISEMENTS:
Thus, the downward-sloping demand curve is in accordance with the law of demand which describes inverse price-demand relationship. It is important to note here that behind this demand curve or price-demand relations always lies the tastes and preferences of the consumer, his income, and the prices of substitutes and complementary goods, all of which are assumed to be constant in describing price-demand relationship.
If any change occurs in any of these other factors, the whole demand schedule or demand curve will change and a new demand schedule or a demand curve will have to be drawn. Further in drawing a demand curve, we assume that the buyer or consumer does not exercise any influence over the price of a commodity, that is, he takes the price of the commodity as given and constant for him.
Reasons for the Law of Demand: Why does Demand Curve Slope Downward?
We have explained above that when price falls the quantity demanded of a commodity rises and vice-versa, other things remaining the same. It is due to this law of demand that demand curve slopes downward to the right. Now, the important question is why the demand curve slopes downward, or in other words, why the law of demand which describe inverse price-demand relationship is valid. We can prove this with marginal utility analysis.
It may however be mentioned here that there are two factors due to which quantity demanded increases when price falls:
ADVERTISEMENTS:
(1) Income Effect:
When the price of a commodity falls, the consumer can buy more quantity of the commodity with his given income. Or, if he chooses to buy the same amount of quantity as before, some money will be left with him because he has to spend less on the commodity due to its lower price.
In other words, as a result of the fall in the price of a commodity, consumer’s real income or purchasing power increases. This increase in real income induces the consumer to buy more of that commodity. This is called income effect of the change in price of the commodity. This is one reason why a consumer buys more of a commodity whose price falls.
(2) Substitution Effect:
ADVERTISEMENTS:
The other important reason why the quantity demanded of a commodity rises as its price falls is the substitution effect. When the price of a commodity falls, it becomes relatively cheaper than other commodities. This induces the consumer to substitute the commodity whose price has fallen for other commodities which have now become relatively dearer.
As a result of this substitution effect, the quantity demanded of the commodity, whose price has fallen, rises. This substitution effect is more important than the income effect. Marshall explained the downward-sloping demand curve with the aid of this substitution effect alone, since he ignored the income effect of the price change.
But in some cases even the income effect of the price change is very significant and cannot be ignored. Hicks and Allen who put forward an alternative theory of demand called as indifference curve analysis of consumer’s behaviour explain this downward-sloping demand curve with the help of both income and substitution effects.
Exceptions to the Law of Demand:
Law of demand is generally believed to be valid in most of the situations.
However the following exceptions to the law of demand have been pointed out:
i. Goods Having Prestige Value:
ADVERTISEMENTS:
One exception to the law of demand is associated with the name of an economist Thorstein Veblen who put forward the view of conspicuous consumption. According to Veblen, some consumers measure the utility of a commodity entirely by its price, i.e., for them, the greater the price of a commodity, the greater it’s utility. Diamonds are often given an example of this case.
The diamonds are considered as prestige goods in the society and for the upper strata of the society the higher the price of diamonds, the higher the prestige value of them and therefore the greater utility or desirability of them. In this case, the consumer will buy less of diamonds at a low price because with the fall in price their prestige value goes down. On the other hand, when the price of diamonds goes up, their prestige value will go up and therefore their utility and desirability. As a result, at a higher price the quantity demanded of diamonds by a consumer will increase.
ii. Giffin Goods:
Another exception to the law of demand was pointed out by Sir Robert Giffin who observed that when the price of bread increased, the low-paid British workers in the early 19th century purchased more bread and not less of it, and this was contrary to the law of demand.
The reason given for this is that Giffin goods are inferior goods in whose case the negative income effect is very large which more than offset the substitution effect. So in their case quantity demanded varies directly with price. After the name of Robert Giffin such goods in whose case there is a direct price-demand relationship are called Giffin goods.
It is important to note that when with the rise in price of a commodity, its quantity demanded increases and with the fall in the price of a commodity, its quantity demanded decreases, as in case of Giffin goods, the demand curve will slope upward to the right and not downward.
ADVERTISEMENTS:
iii. Some Other Exceptions:
There are some other exceptions to the law of demand which are only apparent and not genuine. In other words, these exceptions to the law of demand are false. One of the false exceptions relates to the changes in the expectations of the people regarding prices of the commodities in the future.
Suppose, the rainfall in India in any year does not occur in adequate quantity and there is widespread drought, the expectations of the people will be that the prices would rise in the future. Therefore, even if the prices of food-grains are higher at the present, they would demand greater quantities since they will be expecting that the prices in the future would be still higher.
This is contrary to the law of demand, but in this case to apply the law of demand is not valid. This is because in this case the increase in the quantity demanded is not due to the rise in price but due to the rightward shift in the demand curve as a result of changes in the price expectations of the people.
Further, time-series statistical data regarding the quantities purchased of various goods reveal that larger amounts of them have been purchased at higher prices and smaller quantities have been purchased at lower prices over the course of the business cycle. This is also apparently the violation of the law of demand but properly interpreted it does not contradict the law of demand because this only shows that demands for many commodities increase in times of prosperity of the business cycles due to the increase in the incomes of the people, and the demands for the commodities decrease in times of depression of the business cycles due to the fall in the incomes of the people.
Another false exception to the law of demand is found when a commodity is sold under two brand names whose prices greatly differ. It is often found that some people demand more of a high-priced brand than of the low-priced, although they are almost identical. This author has seen that some of his friends buy more of ‘Supreme Lux’ having a much higher price than ‘Lux’ having a low price even though the two are of almost the same quality.
ADVERTISEMENTS:
However, this is not a real exception to the law of demand. This is because those who buy more of high-priced brand think that the high-priced brand is different from and superior to the low- priced brand. Therefore, for analysing the nature of demand for these brands, they should be regarded as two different commodities.
4. Market Demand Function:
For the business decision making market demand function is of great relevance. As seen above, apart from the determinants of individual’s demand such as price of a product, his income, prices of related commodities, individuals preferences, advertising expenditure, market demand for a product depends on an additional factor, namely the number of consumers which in turn depends on the population of a region or city or country (for which demand is being considered) who consume the product.
Mathematically, market demand function for a product can be expressed in the general form as under:
QD = f(P1, I, Pr, T, A, N) where the additional factor is N which stands for the number of consumers or population.
For the purpose of estimation of demand for a product we need a specific form of the above market demand function. Generally, it is the linear form which is chosen for estimating market demand function.
So in the linear form, the market demand function is given below:
ADVERTISEMENTS:
QD = C + b1 Px + b2I + b3Pr + b4 T + b5T + b6N
C is a constant term which shows the intercept of the market demand curve on the X- axis. b1, b2, b3 etc. are coefficients (these are generally called parameters) which show the quantitative relationship of various independent variables with the market demand. In other words, these coefficients, b1, b2, b3 show how much market demand changes as a result of a unit change in various variables such as price, income, advertising expenditure, population (i.e., the number of consumers).
As pointed out in case of individual demand, in economics it is considered important and useful to focus on the relationship between quantity demanded of a product and its price, holding other factors constant. Therefore, if income (I), prices of other related commodities (Pr), tastes or preferences of the people (T), advertising expenditure are held constant, the market demand function.
QD = C + b1 Px
where C is the constant term in the function or intercept of the market demand curve on the X-axis, b1 is the coefficient which indicates how much quantity demanded of product X in the market will change as a result of a unit change in its own price, other factors held constant.
Market Demand Curve:
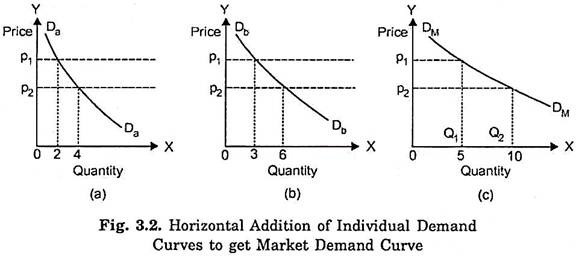
We have drawn an individual’s demand curve of a commodity. We can obtain the market demand curve by making horizontal addition of the demand curves of all individuals buying the commodity. In order to do so we add or sum up the various quantities demanded by the number of consumers in the market. In this way we can obtain the market demand curve for a commodity which like the individual consumer’s demand curve will slope downward to the right.
How this summation is done is illustrated in Fig. 3.2. Suppose there are two individual buyers of a good in the market. Fig. 3.2 (a) and (b) show the demand curves of the two independent individual buyers. Now, the market demand curve can be obtained by adding together the amounts of the good which individuals wish to buy at each price. Thus, at price P1 the individual A wishes to buy 2 units of the good; individual B wishes to by 3 units of the good. The total quantity of the good that the two individuals plan to buy at price P1 is therefore 2 + 3 = 5, which is equal to OQ1 in Fig. 3.2 (c).
Now, as shall be seen from the figure that at price OP2, individual a demands 4 units and individual B demands 6 units of the commodity. So the market demand at price OP2 of the commodity is 4 + 6 = 10 units or OQ2. Similarly, we can plot the quantity of the good that will be demanded by the two individuals at every other price of the good. When all the points showing the amounts demanded of the good at various prices are joined we get a market demand curve for the good.
For the sake of convenience we have supposed that there are two individuals or buyers in the market for a good. Whatever be the number of individuals in the market, their demand curves can be added together, as illustrated above, to get a market demand curve for the good.
The market demand curve slopes downward to the right, since the individual demand curves, whose lateral summation gives us the market demand curve, normally slope downward to the right. Besides, as the price of the good falls, it is very likely that the new buyers will enter the market and will further raise the quantity demanded of the good. This is another reason why the market demand curve slopes downward to the right.
Demand and Quantity Demanded:
It is important to understand the distinction between the concepts of demand and quantity demanded as they are often confused with each other. Demand represents the whole demand schedule or curve and shows how price of a good is related to the quantity demanded which the consumers are willing and able to buy, other factors which determine demand being held constant.
On the other hand, quantity demanded refers to the quantity which the consumers buy at a particular price. The quantity demanded of a good varies with changes in its price; it increases when price falls and decreases when price rises. The changes in demand for a commodity occur when there is a change in the factors other than price namely, tastes and preferences of the people, incomes of the consumers, and prices of related goods.
5. Extension and Contraction in Demand:
We have studied above the demand schedule, demand curve and the law of demand. All these show that when the price of a good falls quantity demanded of it rises, and when its price rises, its quantity demanded falls, other things remaining the same. When as a result of changes in price, the quantity demanded rises or falls, extension or contraction in demand is said to have taken place.
Therefore, in economics, the extension and contraction in demand are used when the quantity demanded rises or falls as a result of changes in price, demand curve remaining the same. When the quantity demanded of a good rises due to the fall in price, it is called extension of demand, and when the quantity demanded falls due to the rise in price, it is called contraction of demand. For instance, suppose the price of bananas in the market at any given time is Rs. 10 per dozen and a consumer buys one dozen of them at that price.
Now, if other things such as tastes of the consumer, his income, prices of other goods remain the same and price of bananas falls to Rs. 8 per dozen and the consumer now buys 2 dozen bananas, then extension in demand is said to have occurred. On the contrary, if the price of bananas rises to Rs. 12 per dozen and consequently the consumer now buys half a dozen of the bananas, then contraction in demand is said to have occurred.
It should be remembered that extension and contraction in the demand takes place as a result of changes in the price alone when other determinants of demand such as tastes, income, propensity to consume and prices of the related goods remain constant. These other factors remaining constant means that the demand curve remains the same, that is, it does not change its position; only the consumer moves downward or upward on it.
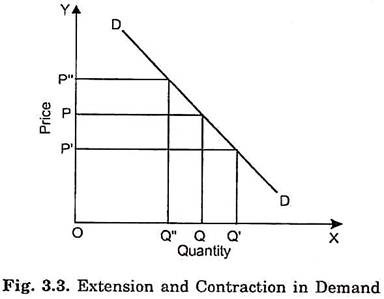
The extension and contraction in demand is illustrated in Fig. 3.3. Assuming other things such as income, tastes and fashion, prices of related goods remaining constant, a demand curve DD has been drawn. It will be seen in this figure that when the price of the good is OP, the quantity demanded of the good is OQ.
Now, if the price of the good falls to OP’, the quantity demanded of the good increases to OQ’. This is called extension or expansion in demand. On the other hand, if the price of the good rises to OP”, other factors remaining the same, the quantity demanded of the good falls to OQ”. This is contraction in demand. This extension or contraction in demand takes place as a result of changes in price along other a given demand curve, other factors Quantity determining demand being held constant.
6. Factors Determining Market Demand:
We have explained above how the demand changes as a result of changes in price, other factors determining being held constant. We shall now explain in detail these other factors which determine market demand for a commodity. These other factors determine the position or level of demand curve of a commodity. It may be noted that when there is a change in these non-price factors, the whole curve shifts rightward or leftward as the case may be.
The following factors determine market demand for a commodity:
(i) Tastes and Preferences of the Consumers:
An important factor which determines the demand for a good is the tastes and preferences of the consumers for it. A good for which consumers’ tastes and preferences are greater, its demand would be large and its demand curve will therefore lie at a higher level. People’s tastes and preferences for various goods often change and as a result there is change in demand for them.
The changes in demand for various goods occur due to the changes in fashion and also due to the pressure of advertisements by the manufacturers and sellers of different products. On the contrary, when certain goods go out of fashion or people’s tastes and preferences no longer remain favourable to them, the demand for them decreases.
(ii) Income of the People:
The demand for goods also depends upon the incomes of the people. The greater the incomes of the people, the greater will be their demand for goods. In drawing the demand schedule or the demand curve for a good we take income of the people as given and constant.
When as a result of the rise in the income of the people, the demand increases, the whole of the demand curve shifts upward and vice-versa. The greater income means the greater purchasing power. Therefore, when the incomes of the people increase, they can afford to buy more. It is because of this reason that the increase in income has a positive effect on the demand for a good.
When the incomes of the people fall they would demand less of a good and as a result the demand curve will shift downward. For instance, during the planning period in India the incomes of the people have greatly increased owing to the large investment expenditure on the development schemes by the Government and the private sector.
As a result of this increase in incomes, the demand for good grains has greatly increased which has resulted in the food problem. Likewise, when because of drought in a year the agriculture production greatly falls in the incomes of the farmers decline. As a result of the decline in incomes of the farmers, they will demand less of the cotton cloth and other manufactured products.
(iii) Changes in Prices of the Related Goods:
The demand for a good is also affected by the prices of other goods, especially those which are related to it as substitutes or complements. When we draw the demand schedule or the demand curve for a good we take the prices of the related goods as remaining constant. Therefore, when the prices of the related goods, substitutes or complements, change, the whole demand curve would change its position; it will shift upward or downward as the case may be.
When the price of a substitute for a good falls, the demand for that good will decline and when the price of the substitute rises, the demand for that good will increase. For example, when the prices of the tea as well as the incomes of the people remain the same but the price of the coffee falls, the consumers would demand less of tea than before. Tea and coffee are very close substitutes. Therefore, when coffee becomes cheaper, the consumers substitute coffee for tea and as a result the demand for tea declines.
The goods which are complementary with each other, the change in the price of any of them would favourably affect the demand for the other. For instance, if the price of milk falls, the demand for sugar would also be affected. When people would take more milk, the demand for sugar will also increase. Likewise, when the price of cars falls, the quantity demanded of them would increase which in turn will increase the demand for petrol.
(iv) Advertisement Expenditure:
Advertisement expenditure made by a firm to promote the sales of its product is an important factor determining demand for a product, especially of the product of the firm which gives advertisements. The purpose of advertisement is to influence the consumers in favour of a product.
Advertisements are given in various media such as newspapers, radio, and television. Advertisements for goods are repeated several times so that consumers are convinced about their superior quality. When advertisements prove successful they cause an increase in the demand for the product.
(v) The Number of Consumers in the Market:
The market demand for a good is obtained by adding up the individual demands of the present as well as prospective consumers of a good at various possible prices. The greater the number of consumers of a good, the greater the market demand for it.
Now, the question arises on what factors the number of consumers for a good depends. If the consumers substitute one good for another, then the number of consumers for the good which has been substituted by the other will decline and for the good which has been used in place of the other, the number of consumers will increase.
Besides, when the seller of a good succeeds in finding out new markets for his good and as a result the market for his good expands the number of consumers for that good will increase. Another important cause for the increase in the number of consumers is the growth in population. For instance, in India the demand for many essential goods, especially food-grains, has increased because of the increase in the population of the country and the resultant increase in the number of consumers for them.
(vi) Consumers’ Expectations with Regard to Future Prices:
Another factor which influences the demand for goods is consumers’ expectations with regard to future prices of the goods. If due to some reason, consumers expect that in the near future prices of the goods would rise, then in the present they would demand greater quantities of the goods so that in the future they should not have to pay higher prices. Similarly, when the consumers hope that in the future the prices of good will fall, then in the present they will postpone a part of the consumption of goods with the result that their present demand for goods will decrease.
7. Shifts in Demand: Increase and Decrease in Demand:
When demand changes due to the factors other than price, there is a shift in the whole demand curve. Apart from price, demand for a commodity is determined by incomes of the consumers, his tastes and preferences, prices of related goods.
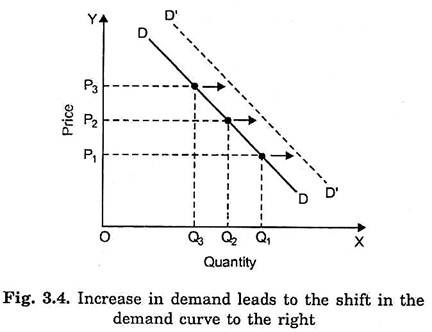
Thus, when there is any change in these factors, it will cause a shift in demand curve. For example, if incomes of the consumers increase, say due to the hike in their wages and salaries or due to the grant of dearness allowance, they will demand more of a good, say cloth, at each price. This will cause a shift in the demand curve to the right as is shown in Fig. 3.4. To being with DD is the demand curve.
With the increase in income, the demand curve shifts to the right to D’D’ which implies that at each price such as P1, P2, P3 the consumers demand more of the commodity than before. Similarly, if preferences of the people for a commodity, say colour TV, become greater, their demand for colour TV will increase, that is, the demand curve will shift to the right and, therefore, at each price they will demand more colour TV.
The other important factor which can cause an increase in demand for a commodity is the expectations about future prices. If people expect that price of a commodity is likely to go up in future, they will try to purchase the commodity, especially a durable one, in the current period which will boost the current demand for the good and cause a shift in the demand curve to the right.
The prices of related commodities such as substitutes and complements can also change the demand for a commodity. For example, if the price of coffee raises, other factors remaining the constant, this will cause the demand for tea, a substitute for coffee, to increase and its demand curve to shift to the right.
Thus, increase in demand occurs due to the following reasons:
(i) The fashion for a good increases or people’s tastes and preferences becomes more favourable for the goods;
(ii) Consumers’ income increases;
(iii) Prices of the substitutes of the good in question have risen
(iv) Prices of complementary goods have fallen;
(v) If the people expect that price of a commodity will rise in future.
(vi) Owing to the increase in population or as a result of expansion in market, the number of consumers of a good has increased.
(vii) increased advertisement for a good has favourably increased the preferences for a good.
If there is any above change, demand will increase and the demand curve will shift to the right.
Decrease in Demand and Shift in the Demand Curve:
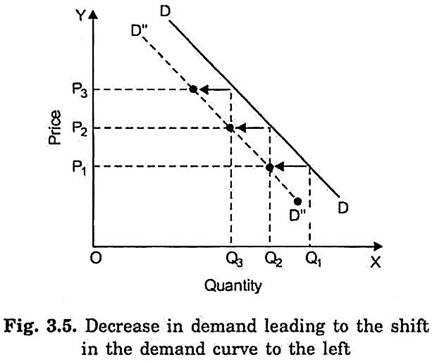
If there are adverse changes in the factors influencing demand, it will lead to the decrease in demand causing a shift in the demand curve to the left as shown in Fig. 3.5. For example, if due to inadequate rainfall agricultural production in a year declines; this will cause a fall in the incomes of the farmers.
This fall in the incomes of the farmers will cause a decrease in the demand for industrial products, say cloth, and will result in a shift in the demand curve to the left as shown in Fig. 3.5. It will be seen from Fig. 3.5, that as a result of decrease in demand, the demand curve shifts to the left to D”D” and at each price such as P1, P2, P3 the farmers demand less of cloth than before.
Decrease in demand may occur due to the following reasons:
(i) A good has gone out of fashion or the tastes of the people for a commodity have declined;
(ii) Incomes of the consumers have fallen;
(iii) The prices of the substitutes of the commodity have fallen;
(iv) The prices of the complements of that commodity have risen; and
(v) If the people expect that price of a good will fall in future this will affect their demand in the present period.
