
Let us make an in-depth study of the competitive firm’s short-run supply curve.
A supply curve, tells us how much output it will produce at every possible price.
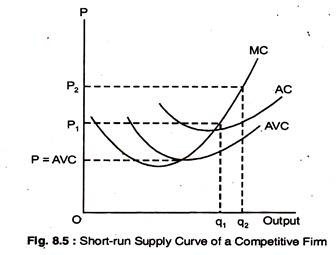
We have seen that competitive firms will increase output to the point at which P = MC, but they will shut down if P < AVC. Thus, for positive output the firm’s supply curve is the portion of the MC curve that lies above the AVC curve.
Since the MC curve cuts the AVC curve at its minimum point, the firm’s supply curve is its MC curve above the minimum point of AVC. For any P > minimum
ADVERTISEMENTS:
AVC, the profit-maximising output can be read from the graph. At a price P1 in Fig. 8.5, for example, the quantity supplied will be and at price P2, it will be q2. For P < minimum AVC, the profit-maximising output is equal to zero. Fig. 8.5 shows that the entire supply curve is that part of the MC curve which is above the minimum point of AVC curve.
Short-run supply curves for competitive firms slope upwards for the same reason that the MC increases — the presence of diminishing returns to one or more factors of production. As a result, an increase in the market price will induce those firms already in the market to increase the quantities they produce.
The higher prices make the additional production profitable and also increase the firm’s total profit because it applies to all units that the firm produces.