In this article we will discuss about the isoquant of a firm under returns to scale.
It is assumed, that the quantities of all the inputs used by a firm are changed in the same proportion. Therefore, if the firm uses only two inputs, X and Y, then these inputs would always be used in some fixed proportion.
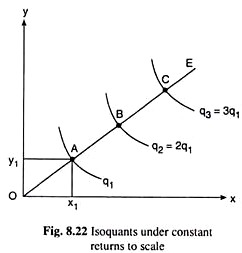
For example in Figure 8.22, if the firm uses any particular input combination A(x1, y1) that lies on any straight line through the origin like OE, then the ratio of the y to x, y1/x1, would itself be the slope of the line OE.
If the firm plans to use another combination of the inputs by changing x and y in the same ratio, i.e., by keeping the input proportion fixed, then it would have to move to another combination along the line OE. For we know that at any (x, y) point on the line OE, the slope of the line or the y/x ratio is a constant.
ADVERTISEMENTS:
We also know from simple mathematics that if the firm moves from any point A to another point B along the straight line OE, then the proportionate change in x and y would be the same as the ratio of distance OB to distance OA. For example, in Fig. 8.22, if we have OB = 2.OA, then we would say that, as compared with point A, the firm’s use of both the inputs has been twice as much at point B.
Now if the quantity of output at the point A be q = q1, then in the case of constant returns to scale, we would obtain q = 2q1 = q2 (say), at point B, i.e., here output along the isoquant through A would be q = q) and the output along the isoquant through B would be q = q2 = 2q1.
Similarly, if the firm moves from point B to point C along the straight line OE and if we have, AB = BC or OC = 3.0A, then as compared with point A, x and y at point C would be thrice as much, and in the constant returns case, output at C, or, along the IQ through C, would be q = 3q1 = q3 (say).
ADVERTISEMENTS:
Therefore, that in Fig. 8.22, in the case of constant returns to scale, if we move along any straight line (or ray) like OE, we would find that the distance (OA) between the point of origin (O) and the IQ, q1, the distance (AB) between the IQ, q1 and the IQ, 2q1, the distance (BC) between the IQ, 2q1, and the IQ, 3q1,…, would all be equal to each other (OA = AB = BC =………………).
In other words, the IQ map shown in Fig. 8.22, represents the constant returns to scale.
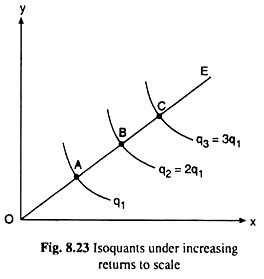
The IQ map in Fig. 8.23, on the other hand, represents the law of increasing returns to scale. For, here, along the ray OE, we have OA > AB > BC > … where the points A, B, C,… lie on the IQs of output q1, 2q1, 3q1, . . . . Here since AB < OA, we have OB < 2 OA, i.e., while moving from the point A to the point B, the firm has increased x and y by less than twice as much, whereas output has doubled from q1 to 2q1.
That is, in this case output has increased more than in proportion to the increase in the input quantities. Therefore, there has been increasing returns to scale. Similarly, in the cases of BC < AB, etc., we would also obtain the increasing returns to scale.
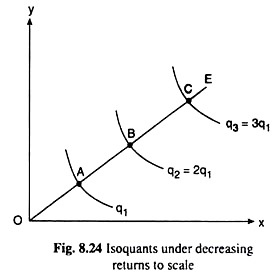
Lastly, the IQ map in Fig. 8.24 represents the law of decreasing returns to scale. For, along the ray OE here, we have OA < AB <BC <… where the points A, B, C,. . . lie on the IQs, respectively, of output q1, 2q1, 3q1,… Here, since AB > OA, we have OB > 2.OA, i.e., while moving from the point A to the point B along OE, the firm has more than doubled the quantities of inputs X and Y while output has just doubled from q, to 2q,.
That is, in this case, output has increased less than in proportion to the increase in the input quantities. Therefore, there has been decreasing returns to scale. Similarly, in the cases of BC > AB, etc., we would also obtain decreasing returns to scale.


