In the equilibrium position, aggregate demand and aggregate supply are equal to each other.
In addition, the theory of employment can be obtained by effective demand. In turn, the effective demand is equivalent to the expenditure made on consumption and investment products.
Therefore, an increase in consumption or investment would lead to an increase in the effective demand. As a result, employment in an economy would also increase. Thus, we can say that consumption and investment play a crucial role in determining income and employment.
Keynes has proposed several concepts regarding the consumption and investment that would help in determining income and employment. Keynes has provided a concept called propensity to consume with respect to consumption. In addition, for investment, he has given the concept inducement to invest. The concept of propensity to consume helps in determining consumption expenditure in an economy. On the other hand, inducement to invest helps in determining income with the help of marginal efficiency of capital and rate of interest.
ADVERTISEMENTS:
Marginal efficiency of capital depends on two factors, namely, expected profit in future and cost of replacing capital goods. If the expected profit rate in future is greater, then the inducement to invest would also be high. In addition, the inducement to invest would also be greater, if the replacement cost of a machinery or equipment is less.
On the other hand, if the expected profit rate is same while the rate of interest decreases, then it would lead to an increase in the inducement to invest. Let us understand the concepts of propensity to consume and inducement to invest.
Propensity to Consume:
Propensity to consume is the part of income spent on the consumption of products and services. It is not referred to the consumption done by an individual, but it is the total consumption of all the individuals in an economy. However, for understanding the consumption pattern of individuals in an economy, the individual consumption pattern would provide valuable information.
ADVERTISEMENTS:
The consumption pattern also provides an idea about the saving behavior of individuals in an economy as the part of income not consumed represents the saving. Propensity to consume is also termed as consumption function that depends on the aggregate consumption in an economy.
Consumption and consumption function are two different terms. Consumption represents to the spending made on the consumption of products and services at the specific income level. However, consumption function or propensity to consume represents the schedule of consumption expenditure at different levels of income.
The increase in income would lead to an increase in the consumption expenditure. Therefore, the consumption function provides a relationship between two factors, namely, total consumption expenditure and gross national income.
The consumption rate can be influenced by a number of factors, such as real income of an individual, past savings, and rate of interest. Among these factors, real income is the major factor that affects the consumption rate.
ADVERTISEMENTS:
This is because past savings of individuals are generally very less in the form of life insurance, provident funds, and fixed deposits. Individuals are not able to take out such savings for immediate consumption purposes. Therefore, past savings have a very small or negligible impact on the consumption of an individual.
In case of rate of interest, an increase in it would make individuals to save more as they would be able to earn more. However, if individuals are saving for a specific purpose and rate of interest rises, then they would save less and get the same amount of return.
For example, if individual A wants to get Rs. 110, he is required to save Rs. 100. In case the rate of interest increases to 10%, then he/she would save less than Rs. 100 and can get Rs. 110 after one year.
Average and Marginal Propensity to Consume:
Average and marginal propensity to consume helps in determining the relationship between income and consumption. Average propensity to consume indicates a relationship between total consumption and total income in a particular time frame. On the other hand, marginal propensity to consume represents an incremental change produced in the consumption rate due to the change in income.
The average propensity to consume can be represented as follows:
APC = C/Y
Where, C = Consumption
Y = Income
ADVERTISEMENTS:
Marginal propensity to consume can be expressed as follows:
MPC= ΔC/ΔY
Where, ΔC = Incremental change in consumption
ΔY = Incremental change in income
ADVERTISEMENTS:
Generally, an increase in income would lead to an increase in consumption rate. However, an increase in consumption is less than the increase in income. In such a case, marginal propensity to consume is less than one (mpc<1). It can be plotted on graph as a straight line.
The slope of graph represents an additional income spent on the consumption of products and services. Marginal propensity to consume would be less than one because the total additional income is not spent on consumption, some part is saved. Let us understand this concept with the help of an example.
Example-1:
Table-1 represents the rate of consumption and savings at different levels of income:
ADVERTISEMENTS:
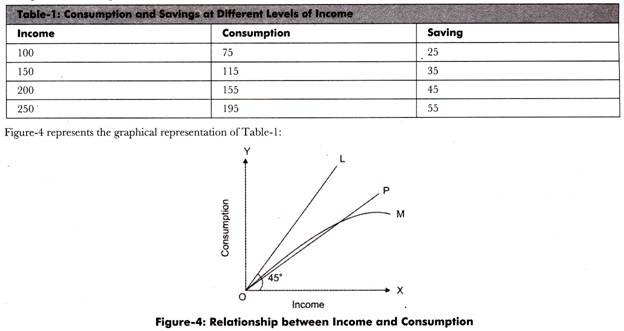
In Figure-4, line OL, representing an equal distance from X and Y axes, signifies a relationship between income level and consumption rate. It makes an angle of 45° from both the axes. In Figure-4, OP and OM curves also represent the income- consumption relationship; however, they are not alike.
If the OP curve moves along with the OL line, then it would show that mpc is equal to one, which is not a real concept. Therefore, income-consumption curve, OP is not drawn at 45° angle. The marginal propensity to consume can be determined by drawing a tangent to the angle produced by the income-consumption curve with the x- axis, which is expressed as follows:
MPC = tan <POX
The OP curve represents a straight line, which shows that marginal propensity to consume remains constant. However, it is not necessary that the slope of income-consumption curve is always a straight line; it can also be flattened.
A flat income-consumption relationship curve shows that with increase in income, the consumption needs are more satisfied. This in turn, increases the savings in an economy. This phenomenon is represented by OM curve, which shows that with the increases in income the marginal propensity to consume decreases.
ADVERTISEMENTS:
Keynes View on Consumption Function:
As discussed above, Keynes has given a number of concepts to determine the income and consumption.
Some of the concepts given by Keynes to understand the consumption function are as follows:
(a) APC:
Stands for average propensity to consume.
The formula used for calculating APC is as follows:
ADVERTISEMENTS:
APC = C/Y
Where, C = Consumption
Y = Income
(b) MPC:
Stands for marginal propensity to consume. It represents the percentage change produced in consumption rate due to the percentage change in income.
The formula used for calculating MPC is as follows:
ADVERTISEMENTS:
MPC = ΔC/ΔY
Where, ΔC = Incremental change in consumption
ΔY = Incremental change in income
(c) APS:
Stands for average propensity to save.
The formula used for calculating APS is as follows:
ADVERTISEMENTS:
APS= S/Y
Where, S = Savings
Y = Income
(d) MPS:
Stands for marginal propensity to save. It represents the percentage change produced in savings due to the percentage change in income.
The formula used for calculating MPS is as follows:
MPS= ΔS/ΔY
Where, ΔC = Incremental change in consumption
ΔY = Incremental change in income
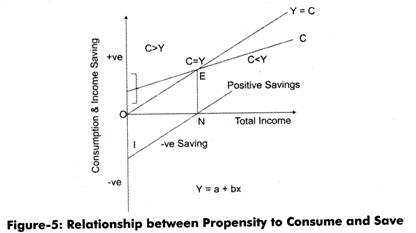
Figure-5 represents a relationship between propensity to consume and propensity to save:
In Figure-5, C represents the consumption curve at 45° angle in which consumption and income become equal. At point E C is equal to Y (C=Y). Before reaching the point E, C is greater than Y (C>Y). It implies that consumption is more than income and savings are negative. Individuals generally utilize their past savings for consumption purposes. However, when C is greater than Y, income is higher, but consumption is less.
According to the Keynes Fundamental Law of Consumption, an increase in income would increase the consumption rate but at a tar Dace than the income. In developing countries, the consumption rate is higher than their respective income (C>Y). On the other hand, in delved countries, the income is higher and consumption is low (C<Y).
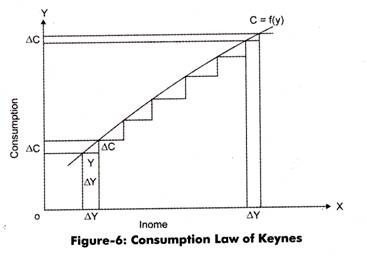
The Fundamental Law of Consumption is represented graphically in Figure-6:
In Figure-6, the curve of consumption is represented as C= f(y). Initially, MPC is higher, which implies that the change produced in consumption due to the change in income is quite high. Generally, increase in income brings a greater change in the consumption pattern of individuals.
However, as shown in Figure-6, when there is a movement in mpc curve at the right side, an increase in income leads to a decrease in consumption rate. Thus, Keynes proved that an increase in income would lead to an increase in consumption rate, but at a slower pace.
Propensity to Save:
The relationship between income and consumption provides information regarding the saving pattern of individuals in an economy.
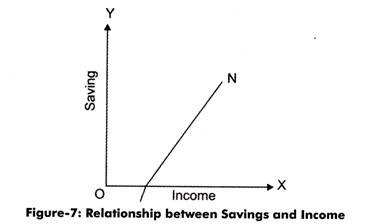
Let us understand the concept of propensity to save by plotting a graph that represents income and savings of individuals in an economy, as shown in Figure-7:
In Figure-7, line N represents the saving-income curve. The marginal propensity to save can be determined with the help of the slope of saving-income curve. Marginal propensity to save is the incremental change in the savings produced due to the incremental change in income of individuals.
The marginal propensity to save can be calculated with the help of following formula:
MPS= ΔS/ΔY
It can also be calculated by using the following formula:
MPS = 1 – ΔC/ΔY
Or,
MPS = 1 – MPC
Factors Affecting Consumption Function:
When propensity to consume is stable, it does not imply that consumption expenditure would also be constant. The consumption expenditure always changes with change in income. However, consumption changes in a set pattern. In such a case, the change in income produces change in consumption, while keeping the consumption-income schedule constant.
However, in the long run, the propensity to consume does not remain stable. There are certain factors that are responsible for bringing changes in the propensity to consume. They are broadly categorized into two factors, namely, objective factors and subjective factors.
These two factors are explained as follows:
(a) Objective Factors:
Include distribution of income, fiscal policy, changes in rate of interest and business expectations, windfall profits and losses, and liquidity preference. The size and distribution of national income equally affect the consumption pattern of individuals. The average and marginal propensity to consume of lower income groups is more than high income groups in an economy.
For example, if an individual from the low-income group gets a certain amount of additional income, say Rs. 100, then he/she would spend it to satisfy his/her needs that are unfulfilled due to lack of income. However, if the same amount of additional income is provided to an individual from the high-income group, then he/she would save it for future.
This is because of the reason that individuals from high-income group have enough memory to satisfy their needs and do not have an immediate desire to fulfill. Thus, it can be concluded that low-income group people are more likely to involve in consumption while high-income group prefer savings.
Fiscal policy is another factor that influences the consumption function of an economy. It is related to the taxation schemes of a government. If the tax rate reduces, it would yield more post-tax income, which would further increase the consumption expenditure of individuals and vice-versa.
Apart from this, another factor, business expectations also play an important role in determining the income-consumption relationship on consumption function by affecting the income of some classes of individuals. The windfall profits and losses bring changes in the savings of individuals more than their consumption patterns.
Therefore, the effect of business expectations on consumption function is less. Similarly, when an individual keeps income in liquid form, it would reduce their consumption, thus, hardly affects the consumption function.
(b) Subjective Factors:
Involve the behavior pattern of individuals and organizations in determining the consumption function. According to Keynes, these are the major factors that directly affect the consumption function. Individuals save or consume their income according to their desires and requirements. There are various factors that encourage individuals to save some part of their income for future use.
These factors can be children education, daughters’ marriage, illness and unemployment in future, comfortable life at the old age, and providing a better life to successors. On the other hand, organizations require savings for expanding their business, having financial support against depreciation and obsolescence, and coping with natural calamities.
Inducement to Invest:
Inducement to invest means encouraging individuals and organizations for investment. Public organizations invest in projects that would yield them high profit immediately or in future. According to Dillard, “The inducement to invest is determined in Keynes’ analysis by the businessmen’s estimation of the profitability of investment in relation to the rate of interest on money for investment. The expected profitability of new investment is called the marginal efficiency of capital.” Inducement to invest is affected by two factors, namely marginal efficiency of capital and rate of interest.
These two factors are explained as follows:
(a) Marginal Efficiency of Capital:
Indicates the profit that can be derived by employing an additional unit of capital. The sources of investment for an investor are either his/her own saving or borrowed funds. In case the investor is utilizing his/her own savings, then he/she not only has to bear the risk, but also has to lose the interest that he/she can earn on savings.
Likewise, if the investor is borrowing funds, then he/she needs to pay interest to the creditors as well as need to go through risks. Therefore, an investor would only invest when the expected income on investment is more than the rate of interest. Keynes has termed the expected income on investment as marginal efficiency of capital.
Inducement to investment can be determined by taking the difference of marginal efficiency of capital and rate of interest. When the difference between the marginal efficiency of capital and rate of interest is greater or marginal efficiency of capital is greater than the rate of interest, then the inducement to investment is also high.
Marginal efficiency of capital is dependent on the following factors:
(i) Prospective Yield:
Refers to the income derived from an asset, such as machinery and plant, in its life span. Net income of an asset can be determined by taking the difference between the total output and cost incurred on the asset in a year. Prospective yield of an asset can be obtained by taking an aggregate of the net income of every year throughout its life span.
(ii) Supply Price:
Refers to the replacement cost of a fixed asset, such as machines.
Marginal efficiency of capital can be obtained by taking the difference between the prospective yield and supply price. However, supply price remains constant every time; therefore, the marginal efficiency of capital is more influenced by prospective yield as it varies every year due to long and short term expectations of organizations.
Apart from this, the marginal efficiency of capital can also be influenced by behavior of individuals. For example, if investors are optimistic, they would be keen to take risks, which would further result in increase in the marginal efficiency of capital and inducement to invest.
However, pessimistic approach of investors leads to a decrease in marginal efficiency of capital and inducement to invest. This generally happens in the depression period when people resist to invest even at a lower interest rate.
(b) Rate of Interest:
Influences the inducement to invest to a larger extent. There can be two types of interest rates associated with the investment. One rate of interest is that in which the investor needs to pay a fixed amount of interest to the creditor from whom he/she had borrowed for making investment. Another rate of interest is that in which the investor earns interest on his/her own savings by buying government bonds and fixed deposits.
Keynes has defined rate of interest that can be obtained by both supply and demand of money that he further termed as liquidity preference. In short -run, the supply of money does not vary. Therefore, rate of interest is mainly affected by demand of money. According to Keynes, ”Interest is the reward for parting with liquidity.”
In other words, an increase in the rate of interest would decrease the liquidity preferences and vice versa. The rate of interest is also dependent on liquidity preference. When the liquidity preference is more, then rate of interest is also high and a lower liquidity preference would result in low rate of interest.
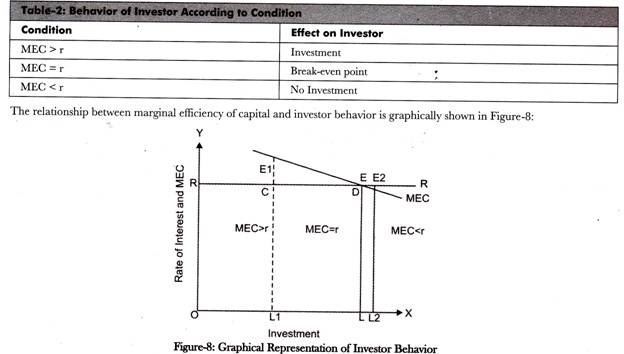
While making investments, it is required to compare the marginal efficiency of capital (MEC) and rate of interest (r) to determine the actual profit that can be obtained by investing. The investor would invest till the time marginal efficiency of capital becomes equal to rate of interest.
When the marginal efficiency of capital is greater than rate of interest, the n the investor would invest more. On the other hand, when the marginal efficiency of capital is less than rate of interest, then the inducement to invest would be nil.
This is summarized in Table-2:
In Figure-8, RR curve denotes the rate of interest while MEC curve shows the marginal efficiency of capital. Let us assume that rate of interest remains fixed at OR level and RR is the fixed rate of interest. At the investment level of OL1, MEC (E1L1) is greater than r (OR).
Therefore, in such a case, investors would invest more and the investment level would reach to OL level. At OL level of investment, MEC (EL)) is equal to r (OR). After that, the investor would not have any inducement to invest. In case, the investor invests further, then MEC (E2L2) would be lower than r (OR), then investor needs to incur losses.
