In this article we will discuss about the cost of an individual firm. Also learn about the nature of costs of an individual firm.
To produce more output in the short run, a firm must employ more labour and buy more raw materials and other inputs. But, if the firm employs more labour and buys more of other inputs like coal, electricity, etc., its cost increase. Thus, to produce more output, a firm must increase its costs.
We may now examine how a firm’s costs change with the level of production. While in accountancy we adopt functional classification of cost (i.e., each type of cost is attributed to a particular function being performed within the organisation) and speak of production overhead or administrative overhead, in economics we adopt a behavioural classification, i.e., we study the behaviour of cost in response to output changes.
A firm’s cost function is expressed as:
ADVERTISEMENTS:
C = f (Q, w, r… T etc.)
Here, C is cost, Q is output, w is wage rate, r is interest rate and T is technology.
Since an individual firm is a small part of the market, we assume that it cannot influence the price it pays for its inputs. Given the prices of its inputs, a firm’s lowest attainable cost of production for each output level is determined by its technology constraint.
Short-Run Costs of an Individual Firm:
ADVERTISEMENTS:
The term ‘short-run’ is defined ‘as a period, of time sufficiently long to allow the firm to change its output from existing capacity, but not sufficient long to allow the firm to make changes in its capacity). In other words, during a short-run period the firm can change its output from the existing capacity but cannot change its capacity or scale of production.
In such a period there are some items of expenses, such as contractual commitments like salaries of the permanent staff, etc. which remain fixed and some items of expenses such as expenses for raw materials, wages of temporary (casual) workers, transport charges, etc. which are variable.
Hence, the short-run total cost of any given output is equal to the sum of all the fixed and variable costs of the firm. From such total costs we can get also short-run average cost (average fixed cost and average variable cost) and marginal cost.
These short-run costs of a firm can be summed up as follows:
ADVERTISEMENTS:
(a) Total Cost:
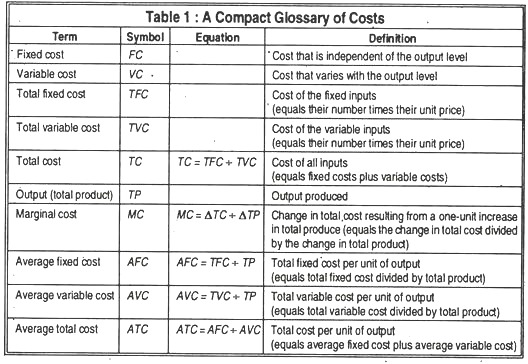
A firm’s total cost is the sum of the costs of all the inputs it uses in production. It includes the cost of renting land, buildings and equipment, the wages paid to workers and normal profit. Short-run total cost is divided in two categories: fixed cost and variable cost.
(b) Total Fixed Cost:
A fixed cost is the cost of a fixed input. Since the quantity of a fixed input does not change as output changes, a fixed cost is a cost that is independent of the output level. The main elements of fixed costs are rent land or building, wages and compensation of the permanent workforce, annual licence fee that has to be paid to the government, interest on bank loans and, of course, depreciation charges.
(c) Total Variable Cost:
A variable cost is a cost of a variable input. If a firm is to change its output it must change the quantity of variable inputs. So, a variable cost is a cost that varies with the output level. The cost of casual labour is variable cost.
Average fixed cost (AFC) is total fixed cost per unit of output.
Average variable cost (AVC) is total variable cost per unit of output.
These costs are calculated as follows:
ADVERTISEMENTS:
TC = TFC + TVC
Dividing each total cost term by the quantity produced we get:
TC/Q = TFC/Q = TVC/Q
Or ATC = AFC + AVC
ADVERTISEMENTS:
Average total cost equals average fixed cost plus average variable cost.
(d) Marginal Cost:
Increase in total cost divided by the increase in its output or equipment, the change in total cost that results from a unit increase in output.
These short-run costs of a firm are illustrated in the following table and diagram:
ADVERTISEMENTS:
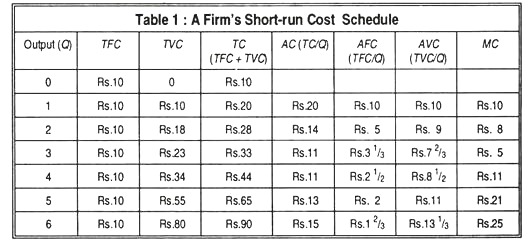
Table 1 illustrates the different short-run costs of a firm at various levels of output. At the 4th unit of output, average cost is the minimum i.e., remains constant, and here it is equal to marginal cost.
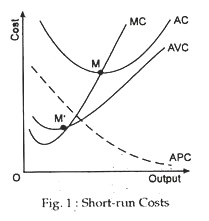
These short-run costs of a firm is also be shown in Fig. 1. Here, the AC curve is the U-shaped indicating a fall in the average cost at the beginning up to’ M and then a rise beyond M. The AFC curve gradually goes downwards indicating a steady fall in the average fixed cost with an increase in the volume (rate) of output. The AVC shows changes in average variable cost with output changes.
It is also U- shaped. At any point, we can add the AFC and the AVC curves to get the AC curve at that point. The MC curve shows marginal cost, falls at first but rises thereafter. Hence, it is also U- shaped, and the rising MC curve passes through the minimum point of the AC curve i.e., through M on the AC curve.
Diagrammatic Illustration:
ADVERTISEMENTS:
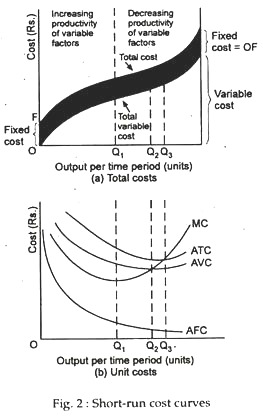
Fig. 2(a) of the illustrates short-run costs as the total cost curves. Total fixed cost is a constant Rs 25. It appears in the figure as the horizontal curve TFC. Total variable cost and total cost both increase with output. They are graphed as the total variable cost curve (TVC) and the total cost curve (TC).
The vertical distance between those two curves is equal to total fixed cost—as indicated by the arrows. Because total fixed cost is a constant Rs. 25, the distance between the purple total variable cost and the blue total cost curve is a constant Rs. 25.
Fig. 2(b) shows the average cost curves. The green average fixed cost curve (AFC) slopes downward. As output increases, the same constant fixed cost is spread over a larger output.
The average total cost curve (ATC) and the purple average variable cost curve (AVC) are U-shaped. The vertical distance between the average total cost and average variable cost curves is equal to average fixed cost—as indicated by the arrows. That distance shrinks as output increases because average fixed cost declines with increasing output.
Fig. 2(b) also illustrates the marginal cost curve, MC. This curve is also U-shaped. The marginal cost curve intersects the average variable cost curve and the average total cost curve at their minimum points. That is, when marginal cost is less than average cost, average cost is decreasing and when marginal cost exceeds average cost, average cost is increasing. This relationship holds for both the ATC and the AVC curves.


