Definitions:
Mode may be defined as the value that occurs most frequently in a statistical distribution.
“The mode is the value occurring most frequently in a series of items and around which the other items are distributed most densely.” —Zizek
In French language ‘Mode’ means ‘Fashion’. Around this value, there is high concentration of the values. It is neither the central value nor the total sum of series which makes any effect on it.
ADVERTISEMENTS:
“Mode is the value which has the greatest frequency density in its immediate neighbourhood.” —A.M. Tuttle
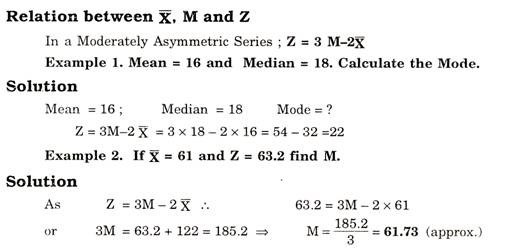
Every distribution cannot have a unique value of Mode. It can have two or even more than two modal values. Such distributions are known as Uni-Modal, Bimodal and Multi Modal
Calculation of Mode:
ADVERTISEMENTS:
A. Individual Series:
The terms are arranged in any order. Ascending or Descending. If each term of the series is occurring once, then there is no mode, otherwise the value that occurs Maximum Times is known as Mode. Mode is often denoted by Z.
Method to Calculate Mode:
(1) Arrange the terms in ascending or descending order (Preferably Ascending)
ADVERTISEMENTS:
(2) Note the term occurring maximum times if it is or is a unique one.
(3) This term is Mode. (Z).
(Note:-If all terms occur once or some terms occur equal number of times, we can’t find Z by this method)
B. Discrete Series:
Here the mode is known by Inspection Method only. Here that variable is the^ Mode where the frequency is highest.; But this method is applicable only if ;
(1) There is a gradual rise or fall in the sequence of frequencies.
(2) The highest frequency and the next highest frequency are not too close
(3) Maximum frequency is not repeated.
Solution:
In the above given series highest frequency is 21 and variable corresponding to i this frequency is 16. Thus Mode (Z) is 16.
Special Note:-But, however sometimes it becomes impossible to locate Mode by inspection as concentration of frequencies is not in a unique manner or fashion as desired for this method.
For such a distribution we have to prepare (1) grouping Table and (2) Analysis
ADVERTISEMENTS:
Table:
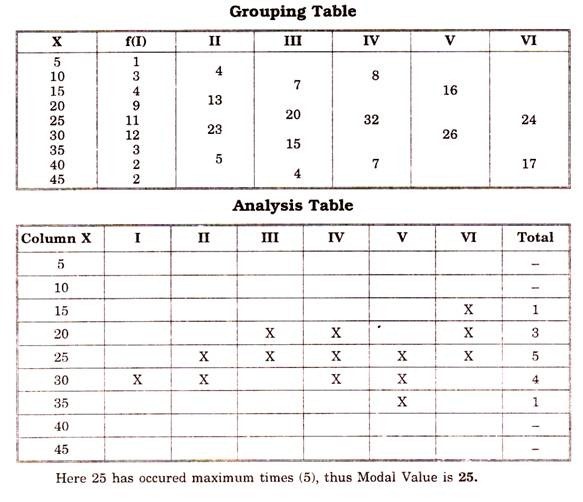
(1) Grouping Table: It has Six Steps as given below.
(1) Frequencies are taken.
(2) Frequencies are added in two(s).
ADVERTISEMENTS:
(3) Leaving first item, frequencies are added in two(s)
(4) Frequencies are added in threes.
(5) Leaving first frequency, frequencies are added in three (s)
(6) Leaving first two frequencies, frequencies are added in three (s).
In each case, take maximum total and put it in a circle or a box to distinguish it from others.
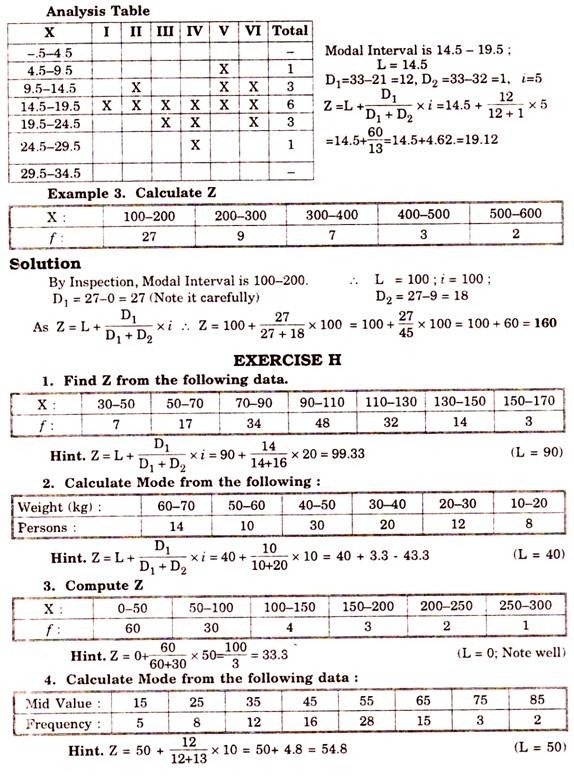
(2) Analysis Table:
ADVERTISEMENTS:
It has following steps:
Step I. Note highest total in each column.
Step II. Note the variable and/or variable in each column corresponding to that total.
Step III. Check if that total is of individual term or more (2 or 3) terms.
Step IV. If the total consists of 2 or more frequencies, all such variables have to be marked as V or x
Step V. Count a/ or x marks in each column.
ADVERTISEMENTS:
Step VI. Variable with maximum √ or x marks denotes mode.
Example 2. Find Mode from the following data:
Solution:
(Note:-Since we can’t make use of inspection method as the frequencies are not most concentrated about highest frequency 12. Thus we will have to proceed for the tables.)
