
Here is a term paper on ‘Portfolio Selection’. Find paragraphs, long and short term papers on ‘Portfolio Selection’ especially written for school and college students.
Term Paper on Portfolio Selection
Term Paper Contents:
- Term Paper on the Introduction to Portfolio Selection
- Term Paper on the Objectives of Investors for Portfolio Selection
- Term Paper on Goal Programming for Portfolio Selection
- Term Paper on the Tax Provisions for Portfolio Selection
- Term Paper on the Risk-Return Analysis of Portfolio Selection
- Term Paper on the Construction of Efficient Portfolio
- Term Paper on the Market Efficiency Theorem of Portfolio Selection
Term Paper # 1. Introduction to Portfolio Selection:
ADVERTISEMENTS:
The portfolio theory is the basis of portfolio selection and relates to the efficient portfolio investment in financial and physical assets, including shares and debentures of companies. A portfolio of an individual or a corporate unit is the holding of securities and investment in financial assets. These holdings are the result of individual preferences and decisions of the holders regarding risk and return and a host of other considerations.
Fact Sheet — Clients’ Data Base:
The following preferences of the investor are to be noted first in investment decisions.
These will constitute the data base of the investor or client:
ADVERTISEMENTS:
(1) Income and savings decisions — how much income can be saved for contingencies and the present position of wealth, income and savings of the investor.
(2) Asset preferences profile — preference for riskless assets like bank deposits or for risky stock market investment:
(a) The degree of risk the investor is capable of taking and willing to take;
(b) The risk aversion and preference for safety and certainty;
ADVERTISEMENTS:
(c) Requirements of regular income;
(d) Objective of capital appreciation;
(e) Objective of speculative gains; etc.
(3) Investor’s objectives, constraints and financial commitments.
(4) Tax brackets into which the investor falls and his preference for planning the tax liability.
(5) Time horizon in which investment should fructify or results expected.
These and other factors constitute the “Fact Sheet” of the investor on the basis of which the individual portfolio is to be structured, constructed and managed.
The motives for saving are varied depending on the individuals. For example, provision for insurance, contingencies, contribution of PF, pension funds, etc., which are mostly contractual obligations, provision for future income, etc., are some of the motives. Some of the savers are influenced by interest return or stable income while others are by speculative gains or get-rich-quick motive.
Term Paper # 2.
Objectives of Investors for Portfolio Selection:
ADVERTISEMENTS:
The investors’ objectives are to be specified in the first place. The objective may be income, capital appreciation or a future provision for contingencies such as marriage, death, birth, etc. Provision for retirement and accident could be covered by contractual obligations like insurance and contributions to PF and pension funds. A certain amount of savings has to be kept as cash with themselves or in deposit with banks or post offices to facilitate daily transactions and purchases.
While cash earns no interest, savings deposit with banks, co-operatives and POs would earn 4.5-6% on savings accounts. But when inflation is prevalent in the economy at the rate of 8-10%, this return of 4.5% will provide only a net negative real return to the savers. So the amounts kept in the form of cash and deposit with banks, etc., should normally be the bare minimum. The rest of the amount has to be spread in various investment avenues, earning higher returns than the average inflation rate of 8-10%.
Term Paper # 3.
Goal Programming for Portfolio Selection:
The investor has to set out his priorities of investment keeping the following goals in mind. All investors would like to have:
ADVERTISEMENTS:
1. Capital appreciation, on growth of wealth.
2. Income, or income with some growth.
3. Liquidity or marketability.
4. Safety or security.
ADVERTISEMENTS:
5. Hedge against inflation.
6. Insurance for future.
7. Provision for contingencies.
8. Provision for specific objectives like marriage, education, etc.
9. Tax Planning.
The investor gets his income from the dividend or yield or interest. There will be capital appreciation also in the case of equities. The liquidity and safety of an investment will depend upon the marketability and the credit rating of the borrower, namely, the company or the issuer of securities. These characteristics vary between assets and securities. An investor is also concerned in having a tax plan to reduce his tax commitments so as to maximise the take home income. For this purpose, investor should specify his income bracket, his liabilities and his preference for tax planning etc.
ADVERTISEMENTS:
The investment avenues have certain characteristics of risk and return and also of some tax concessions attached to them. These tax provisions as such can influence the investors in a very big way as these provisions will alter the risk return scenario of investment alternatives. It is, therefore, necessary that all these avenues should be assessed in terms of yields, capital appreciation, liquidity, safety and tax implications. The investment strategy should be based on the above objectives after a thorough study of the goals of the investor, in the background of characteristics of the investment avenues.
Term Paper # 4.
Tax Provisions for Portfolio Selection:
It is apt to start with the tax-exempt incomes of the securities in which investment can be made. The incomes by way of interest on PSU bonds, N.S. certificates, securities of the Central Government and those deposits specified by the Central Government are exempted from income tax subject to certain limits or conditions. The P.O. deposits, certificates and other claims operated by the POs are exempted from income-tax up to a limit of Rs. 12,000. This exemption is, however, not applicable to Indira Vikas Patra, Kisan Vikas Patra and NSC VIII Issue. Deposits in PPF and NSS are exempted from taxes in the year of deposit and subject to some limits in the year of withdrawal except in the case of NSS, which is, however, taxable in the year of withdrawal.
Under the category of insurance, in addition to LIC policies, the ULIP (of UTI) enjoys popularity due to the tax shelters:
i. Wealth tax exemption for all investments in shares and debentures along with other eligible investments.
ii. Income-tax exemption up to Rs. 12,000 aggregate income from bank deposits, shares, UTI units, P.O. deposits, Mutual Funds and other specified categories of investment.
ADVERTISEMENTS:
All dividend incomes from companies in the hands of investors are free from income tax from 1997-98 onwards, and all income from mutual Fund Schemes are also exempt from April 1999 onwards.
Capital Gains:
Capital gains refer to profits earned on the transfer of capital assets, sale or exchange, etc. These gains are long-term gains, if they are held for more than 36 months for all assets except securities of a company for which this period is 12 months. Long-term capital gains are taxable at a lower rate of 20%. Under Sections 54E and 54F of the Income-tax Act, the long-term capital gains are exempt, if these funds are invested in Central Government securities, UTI and CGI Schemes and other specified schemes approved by the Govt.
Income from interest on debentures and on company deposits is tax deductible at source, if it exceeds Rs. 2,500 p.a. The exemption available from income tax for NSS deposits up to Rs. 40,000 was since withdrawn in 1992-93. Tax exemption is also available in respect of income from government securities, semi- government bonds, bank deposits, income from mutual funds, etc., upto a limit.
In the budget for 1990-91, a new scheme called Equity linked Saving Scheme was announced by the government under Section 88A of Income Tax Act to provide a tax rebate of 20% of the investment made in the eligible assets and new issues, or eligible M.F. Scheme. This was extended upto a limit of total investment of Rs. 70,000 p.a. in 1996-97, in respect of investments in selected avenues such as Insurance, P.F., PPF, NSS and Infrastructure bonds, etc.
Portfolio Construction:
ADVERTISEMENTS:
Portfolio construction refers to the allocation of funds among a variety of financial assets open for investment. Portfolio theory concerns itself with the principles governing such allocation. The objective of the theory is to elaborate the principles in which the risk can be minimised, subject to a desired level of return on the portfolio or maximise the return, subject to the constraint of a tolerable level of risk.
Thus, the basic objective of portfolio management is to maximise yield and minimise risk. Portfolio construction can be based on any Models referred to already and selection and timing of their purchases are accordingly planned by the Portfolio Manager. Portfolio strategy is also formulated and executed as per the plan.
In pursuit of the objectives, the portfolio manager has to set out all the various alternative investments along with their projected return and risk and choose investments which satisfy the requirements of the individual investor and cater to his preferences. The manager has to keep a list of such investment avenues along with the return-risk profile, tax implications, yields and other rights such as convertible options, bonus, rights, etc. A ready reckoner giving out the analysis of the risks involved in each investment and the corresponding returns should be kept.
Term Paper # 5.
Risk-Return Analysis of Portfolio Selection:
All investments have some risks. Investment in shares of companies has larger risks or uncertainty. These risks arise out of variability of returns or yields and uncertainty of appreciation or depreciation of share prices, loss of liquidity etc. The risk over time can be represented by the variance of the returns, while the return over time is capital appreciation plus payout, divided by the purchase price of the share.
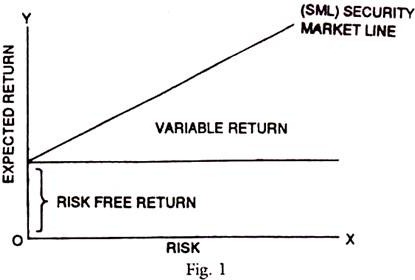
Normally, the higher the risk that the investor takes, the higher is the return. There is, however, a riskless return on capital of about 8-12%, which is the bank rate charged by the RBI or long-term yield on Government securities. This riskless return refers to lack of variability of return and no uncertainty in the repayment of capital. But other risks such as loss of liquidity due to parting with money etc., may, however, remain but are rewarded by the total return on the capital.
ADVERTISEMENTS:
The risk-return relationship can be represented in a diagrammatic form as in Fig. 1.
Risk-return is subject to variation and the objective of the portfolio manager is to reduce that variability and thus reduce the risk by choosing an appropriate portfolio.
There are two types of risks, namely (a) Market risk or systematic risk, and (b) Company risk or unsystematic risk.
The unsystematic risk can be reduced by diversifying the portfolio of scrips up to an optimum level of about 15 shares. These scrips should be so chosen that the risks on each of them are diverse and their variability of return is also different. By investing in such a diverse set of scrips, the total risk can be reduced as some of them may have positive and others negative covariance and they may vary in the degree of risk as well. The risk that can be reduced is called unsystematic risk and these risks are represented diagrammatically in Fig.2.
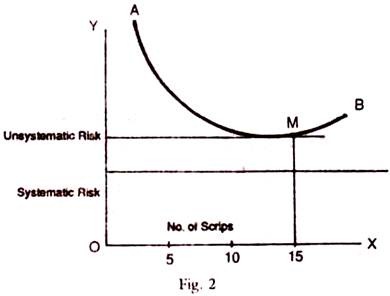
The unsystematic risk can be lowered by diversifying into a basket of scrips. Thus, at the level of 15 scrips in the diagram, the lowest level of risk is obtained at the point M on the AB curve representing the unsystematic risk of the investor. Thus, a degree of diversification of investment is a necessary prerequisite of portfolio management and for reducing the risk. But beyond the point M, the portfolio becomes unmanageable and diseconomies operate as to increase risk rather than reduce it.
In the management of a portfolio, the problem of risk management is vital. Given the individual preference of portfolio holders, the portfolio is to be constructed in such a manner that it is exposed to the minimum risks which the owner can carry, subject to which the returns are to be maximised. Although the market- related risks cannot be reduced, the company-related risks can be eliminated through a proper diversification.
As shown in the above diagram, a proper portfolio diversification into around 15 scrips of different groups of industries and companies would be able to reduce the company-related risks involved almost to a negligible proportion. But these companies and industries should not be unduly related or interdependent or under the same umbrella of industry groups or family of industrialists. An optimum degree of diversification can be secured which would minimise risk and optimise return, if the covariance of scrips included in the portfolio is less than 1 or negative.
Time Horizon of Strategy:
Every investment strategy should have a time horizon from a short period of one year to a few years. Capital gains is considered long-term if equity investment is for at least one year and other types of investment for at least three years. If investment is to be assessed every year, the past experience shows that the equity prices, reflected by the BSE Sensitive Index, may show varying degrees of rise or fall per annum, but over a period of 3 to 5 years, the market index invariably showed a rise of anything above the normal inflation rate of 10% per annum. So investment strategy should be for a medium time period of 3 to 5 years.
Portfolio management encompasses three major categories of activities:
1. Asset allocation — type of assets to be chosen among fixed income securities of the government or private corporate units, preferred stock debentures or equities, etc., of various groups of industries.
2. Review and shifts as between classes of assets to take advantage of risk- return characteristics, or changes in them,
3. Security selection within each asset class such as choosing a higher growth type of companies (blue chips).
Time planning also involves the duration adjustments in a way that cash inflows are generated at the times of expected cash outflows.
Types of Risk:
The risk is measured statistically by the degree of variance or standard deviation of returns. There is also a risk involved in time period of holding (the longer the period, the greater the risk) called liquidity premium. The holding of security is subject to the default risk in repayment of principal called default premium.
The risks also arise due to interest rate variability, purchasing power changes, business default or financial failures. They can be named as interest rate risk, purchasing power risk, business risk, and financial risk, which are all part of systematic risks which lead to a risk premium. These are to be rewarded by a higher return in the marker than can be secured on risk-free assets.
The above is the market-related risk besides, there is also group-related risk pertaining to a group of industries or firms. There is also a specific risk related to a company.
As per the Markowitz model, the investors are generally risk-averse. To suit such investors, the portfolio has to be so designed as to maximise returns for a given level of risk. It is theoretically possible to identify an efficient portfolio, which satisfies the requirements of risk-return for an individual investor. This is possible through a detailed analysis of information on each security in each of the asset classes in terms of expected risk (variance of return) and expected return, and covariance of each of the security with every other security. In simple language, this efficient portfolio is a well-diversified portfolio comprising many securities with a low covariance so that the total degree of risk is the lowest possible. Companies under different industry groups and different family managements and with different characteristics are to be chosen in that portfolio.
Term Paper # 6.
Construction of Efficient Portfolio:
To construct an efficient portfolio, we have to conceptualize various combinations of investments in a basket and designate them as portfolios 1 to n. Then the expected returns from these portfolios are to be worked out. The risk on these portfolios is to be estimated by measuring the standard deviation of different portfolio returns. To reduce the risk, investors have to diversify into a number of securities whose risk-return profiles vary.
Thus, portfolios carry returns to compensate for interest risk (risk-free return) + a premium for purchasing power risk, market risk, business risk and financial risk. All these risks constitute systematic risks, which cannot be reduced or eliminated by diversification. For unsystematic risks, for each individual security and for a combination of securities represented by the basket in the BSE Sensitive Index or National Index, the expected returns and standard deviations can be worked out.
The Betas readily calculated and published are available for E.T. 500 Top Companies listed on the B.S.E. The expected return has to be weighted by the probable chance of getting the return through proper weights and the weighted average return should be worked out.
The standard deviation around the expected return can also be worked out as shown below:
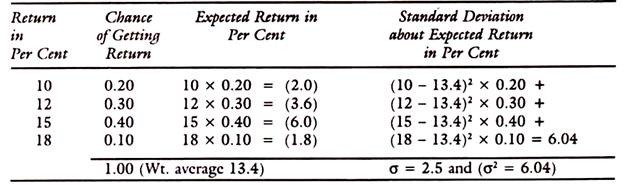
The standard deviation signifies that, on an average, each possible return is 2.5% away from the expected return of 13.4%. The deviation of 2.5% could be on either side of the expected return.
The efficient portfolio can be estimated by ranking the various portfolios in terms of expected return and standard deviations as shown in the following table:
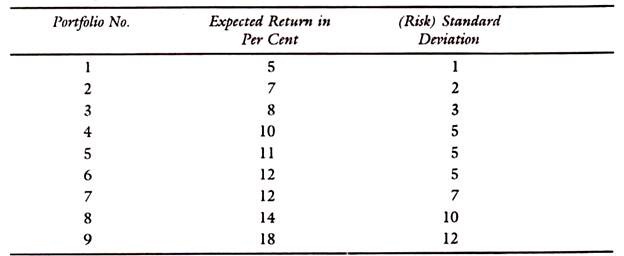
If we compare portfolio Nos. 4 and 5, we see that for the same standard deviation of 5, portfolio No. 5 gives an expected return of 11% higher than that on No. 4, thereby making it an efficient portfolio. If we compare portfolio Nos. 6 and 7, we see that with the same return of 12% in both the portfolios, standard deviation is lower in portfolio No. 6. Thus, portfolio No. 6 is an efficient portfolio.
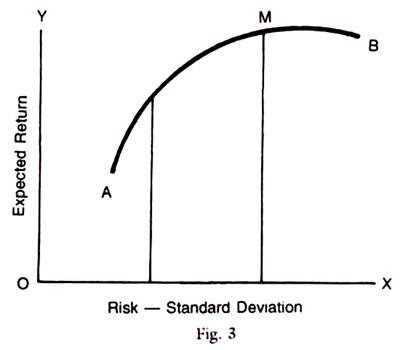
These points can be depicted as in Fig. 3. The expected return is shown on the Y-axis and standard deviation measuring risk on the X-axis. The points connecting the expected return with its standard deviation can be shown as AB graph, constituting the feasible opportunity set. The outermost point on this graph is the most efficient portfolio, say, M on the AB graph while the AB graph is called the efficient frontier. M is the most efficient combination for the individual under consideration.
The individual investor is generally risk-averse according to the well-known author Markowitz. His objectives are influenced by the stage of life, his financial circumstances and psychological makeup. A young investor may have, for example, a higher level of tolerance of risk than a retired person or a middle-aged person. The latter prefers a larger income with less risk. There is a trade-off between risk and return.
According to the capital pricing model, efficient frontier is defined as a risk- return trade-off curve. It is efficient because it provides the maximum return at a given level of risk of the investor. The investor’s capacity to take risk sets the point of optimum efficiency on this curve, which is the best for him. Diversification of securities and assets in the portfolio reduces the risk, provided their covariance is low and they are dissimilar in nature.
The total risk is measured by the standard deviation of the return, and market risk by the concept of Beta. Beta reflects that part of a portfolio’s return and variation in returns which is attributable to the overall movement of the market rather than to any unique characteristic of the Company.
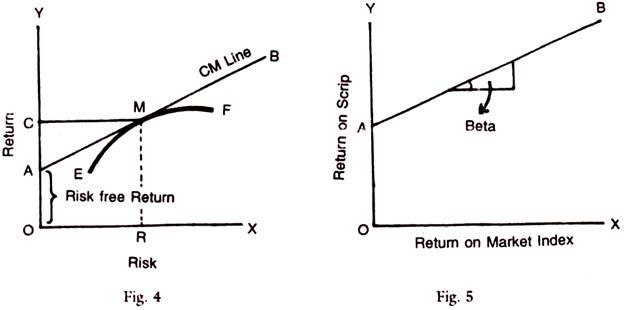
The efficient frontier of Markowitz and the use of Beta can be graphically represented as in Figs. 4 and 5. AB is the capital market line, representing the market possibilities of risk and return (given by the BSE Index). On the same graph, the efficient frontier curve is drawn as EF. At point M, for the given risk of OR, the return is maximised for the investor at OC.
In actual practice, β can be derived by the formula: Price of Scrip A (% age)/ Prices of scrips included in BSE Index (% age) — the relation of the individual scrip to that of the basket of scrips as represented by the BSE Index. If Beta is 1 (slope is 45°), then, on an average, one percentage return on the market basket will be associated with a one percentage return on the individual scrip. If Beta is greater than one it will give a larger return than the average market return.
These high Beta scrips are very volatile and risk is also high. On the other hand, if Beta is less than 1 (called defensive scrips), the risk is low and the return is also lower than the market return. Depending on the investor’s choice, the Beta is to be selected and scrips with such Beta should be held in the portfolio Fig. 5 depicts Beta as the angle made by the line of regression between market return and the individual scrip return.
Term Paper # 7.
Market Efficiency Theorem of Portfolio Selection:
Since the behaviour of the market is outside the control of the investor, he can only reduce the specific component of risk by choosing the individual scrips with proper Betas to achieve the result of diversification and lower the risk. The comparative risks of alternative well-diversified portfolios can be measured by their Betas. If the markets are efficient, the performance of any portfolio would average out to that of the performance of the market and nobody can outperform the market.
In the real world, there are three different levels of efficiency of the stock market, namely, the weak form, the semi-strong form and the strong form. These concepts are useful in portfolio management for investors. In the weak form, the successive changes in stock prices are independent of each other and the historical market data are already embodied in the existing price.
In the semi-strong form, stock prices adjust rapidly to all new public information, both market and non-market data, and action taken after the event will produce no more than random results.
In the strong form, stock prices fully reflect not only all public information but even privately-held information which may later become public.
If, in the real world, the market efficiency is of a strong form, then the performance of any basket of scrips in any portfolio is as good as any other and no individual investor can outperform the market. If however, the market efficiency is of a weak form, there is scope for selection of a portfolio which is optimal for the investor in terms of risk and return and yet outperforms the market by a proper choice of aggressive scrips with Betas suitable for the purpose.