Risk is uncertainty of the income/capital appreciation or loss of both. The two major types of risk are- Systematic or market related risks and unsystematic or company related risks. The systematic risks are the market problems, raw material availability, tax policy or any Government policy, inflation risk, interest rate risk and financial risk. The unsystematic risks are mismanagement, increasing inventory, wrong financial policy, defective marketing, etc.
All investments are risky. The higher the risk taken, the higher is the return. But proper management of risk involves the right choice of investments whose risks are compensating. The total risk of two companies may be different and even lower than the risk of a group of two companies if their risks are offset by each other. Thus, if the risk of Reliance is represented by Beta of 1.90 and of Dr. Reddy’s at 0.70 the total of these two is 1.30, on average. But the actual beta of the group of these two may be less than that due to the fact that co-variances of these two may be negative or independent. It may be more than that if there is a strong positive covariance between them.
Degree of Risk and Risk Free Return:
Risk on some assets is almost zero or negligible. The examples are bank deposits, where the maximum return is 13%. Similarly, investments in Treasury bills, Government Securities etc., are also risk free or least risky. Their return is 13 to 14%.
Tradeoff between Risk and Return:
ADVERTISEMENTS:
All investors should therefore plan their investments first to provide for their requirements of comfortable life with a house, real estate, physical assets necessary for comforts and insurance for life, and accident, and make a provision for a provident fund and pension fund etc., for a future date. They have to take all needed precautions for a comfortable life, before they enter the stock market as it is most risky. But rarely any such plan or design is noticed among investors as they start investment in these markets on the advice of friends, relatives and agents or brokers, without much of premeditation or preparation.
The following chart shows the tradeoff between risk and return. If you want more return, you take more risk and if no risk is taken, only bank deposits are used.
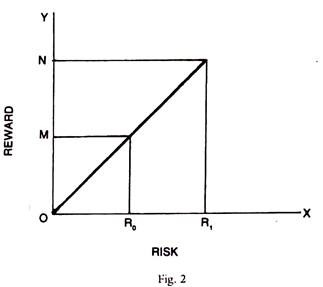
At R0 risk, the reward is only M. If we take a higher risk of R1, the reward will increase to ON. But if reward is desirable, risk is undesirable. Hence, the investor who wants the risk taken to be only Ro, but return to be ON he has to plan his Investments in portfolio. This is what in essence is called portfolio management.
Decomposition of Return:
ADVERTISEMENTS:
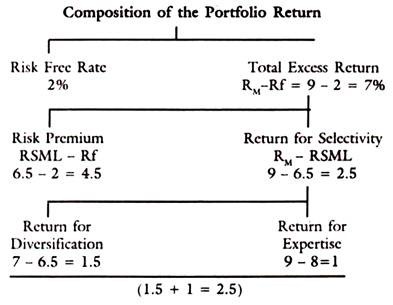
The portfolio return is related to risk. There is also a risk free return, which is secured by any investor by keeping his funds in say bank deposits or post office deposits or certificates. Beyond the risk free rate, the excess return depends on many factors like the risk taken, expertise in selectivity or selection, return due to diversification and return for expertise of portfolio manager.
Fama has presented the decomposition of actual returns into its components. Thus, there is risk free return, excess return, risk premium for taking risk, etc. There is also a return for selecting the proper assets and extra return for the expertise of the portfolio manager.
An example will make the above statement clear, for which the following values can be taken:
Return on Portfolio Rp = 8%
ADVERTISEMENTS:
Return on Market Portfolio = 9%
Risk free Rate = 2%
Risk related to SML (Diversification) = 6.5
Problem:
Give Rf = 10% and Rm =15% were Rf is risk free rate and Rm is the market return and the Expected return and Betas of 4 companies are given below:

Ri1 = 10 + (15 – 10) 1.3 = 16.5
Ri2 = 10 + (15 – 10) 0.8 = 14.0
ADVERTISEMENTS:
Ri3 = 10 + (15 – 10) 1.1 = 15.5
Ri4 = 19 + (15 -10) 1.7 = 18.5
Compared with the Expected return given above in the table those calculated on the basis of calculation of formula for return premium companies 1 and 2 are undervalued. Number 3 company is fairly valued and Number 4 Company is overvalued.
Question:
ADVERTISEMENTS:
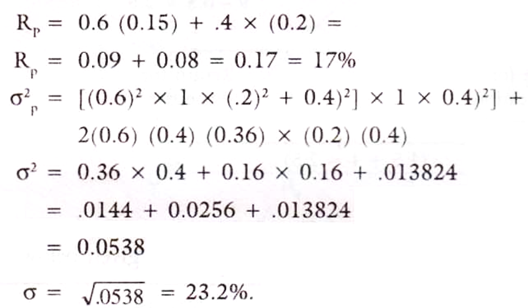
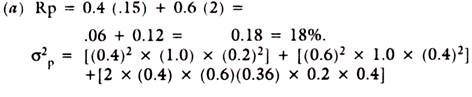
(1) The equity of Orient and Crompton have expected returns of 15% and 20% respectively and the standard deviations (risk) of 20% and 40%. The coefficient of correlation of these two stocks is 0.36.
(a) What is the expected return and standard deviation of portfolio consisting of 40% of Orient and 60% of Crompton?
(b) What is r and s of the portfolio consisting of 60% of Orient and 40% of the Crompton?
ADVERTISEMENTS:
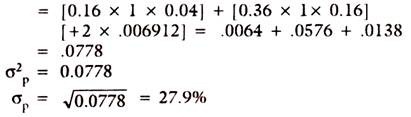
What is used to multiply the first and second terms, namely [(0.4)2 (1.0) x (0.2)2] and [(0.6)2 x 1 x (0.4)2] represent the correlation coefficient for their own variance terms which is 1.0 and the third term represents the covariance.