
Here is a term paper on ‘Diversification’. Find paragraphs, long and short term papers on ‘Diversification’ especially written for school and college students.
Term Paper on Diversification
Term Paper # 1. Meaning of Diversification:
Diversification is a technique of reducing the risk- involved in investment and in portfolio management. This is a process of conscious selection of assets, instruments and scrips of companies/Government securities, in a manner that the total risks are brought down. This process helps in the reduction of risk, under category of what is known as “Unsystematic Bisk” and promotes the optimisation of returns for a given level of risks in portfolio management.
We have seen that in the case of unsystematic risk, the method of lowering the risk is to diversify into a number of companies and a number of industries, for selection of scrips in the portfolio.
ADVERTISEMENTS:
This diversification may take any of the following forms:
(1) Into different types of assets, like gold, real estate, Government securities, corporate securities, etc.
(3) Into different industry lines, namely, plastics, chemicals, engineering, cement, steel, fertilisers, etc.
(4) Into different scrips of companies, viz., new companies, growing companies, new product companies etc.
Term Paper # 2. Principles of Diversification:
ADVERTISEMENTS:
The principles involved in diversification are as follows:
A single company/industry is more risky than two companies/industries. Two companies in say, steel industry are more risky than one company in Steel, and one in Tyres and Tubes.
Two companies, one in steel and the other in chemicals are less risky than two in either steel or chemicals. Similarly, two companies or two industries which are similar in nature of demand or market etc., are more risky than the two in dissimilar industries. Statistically speaking, their covariance should be different. It is proper diversification which involves two or more companies/two or more industries whose fortunes fluctuate independent of one another or in different directions.
Term Paper # 3. Types of Diversification:
i. Random Diversification:
ADVERTISEMENTS:
The traditional belief is that diversification involves “not putting all eggs in one basket.” This policy involves as many baskets as possible; carried to the extreme it is good to have as many companies as possible, and as many industries as possible in one’s portfolio. But this is a misconception as economies of scale operate in the reverse direction (involving diseconomies) with the result that monitoring and review of the portfolio become inefficient, costly and cumbersome and outweigh the benefits of diversification.
There are some accepted methods of efficient diversification:
(1) Randomness in Selection of Companies and Industries:
The probability of reducing risk is more with a random selection as the statistical error of choosing wrong companies will come down due to randomness of selection which is a statistical technique. This involves placing of companies in any order and picking them up in random manner.
(2) Optimisation of Selection Process:
Given the amount of money to be invested there is optimum number of companies, where money can be invested. If the number is too small, risk cannot be reduced adequately and if the number is too big, there will be diseconomies and difficulty of supervision, analysis and monitoring will increase risk again. There is thus a number of companies to be chosen for a given amount of investment.
(3) Adequate Diversification:
Many traditional approaches, emphasise on the need for adequate diversification. This involves as many industries and companies or securities as possible to get the best results. This principle believes in the possibilities of reducing risk to even zero, if there are adequate number of companies and industries. Markowitz emphasised however that what is needed is not only the number of securities to be chosen but the right kind of securities to be chosen. Thus, even if there are a large number of companies they may not reduce risk adequately if they are positively correlated with each other and the market, in which case, they all move in the same direction and many risks will not be reduced and may even increase.
(4) Markowitz Diversification:
ADVERTISEMENTS:
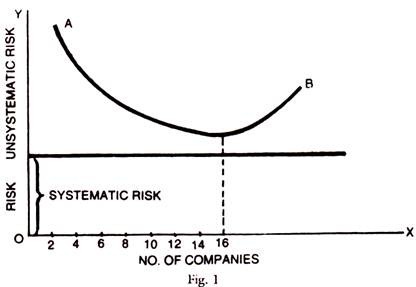
Markowitz emphasised the need for a right number of securities — not too many or too less — and securities which are negatively correlated or not correlated-at all. The purpose of diversification is to reduce the unsystematic risk arising out of company’s policies and performance. Thus, many of such risks can be reduced by a proper choice of companies and industries. Neither random selection, nor adequate number of securities can guarantee this.
One can see from the graph below that for an individual investor a number of around 10-16 companies can secure reduction of risk to an optimum level if they are properly selected as per Markowitz. For Mutual funds or finance companies this number may be higher. The graph shows both systematic and unsystematic risks and the Horizontal line of systematic risk cannot be reduced folly by diversification, but to a large extent unsystematic risk can be reduced by a right choice of companies and to a limited extent.
ii. International Diversification:
ADVERTISEMENTS:
The benefits of diversification are well perceived by Portfolio Managers, that many in developed countries, started investing in foreign bonds, stocks and other instruments. They found that they can extend diversification principle to foreign stocks, bonds etc., to improve returns for a given risk by adopting proper techniques of diversification.
Why International Diversification?
(1) The size and character of International Equity and bond markets are widely varying that it will increase the scope for larger investment and larger diversification.
(2) The returns in local currencies of some foreign countries are higher than in domestic markets. Thus, for example in Singapore, Malaysia, Taiwan and India the returns in local currencies are higher than in U.S. economy.
ADVERTISEMENTS:
(3) The economic trends, business conditions and local profitability and earnings ratios differ widely among countries that the EPS in some developing countries is higher and give opportunity for better diversification and higher returns, through international investments.
(4) International investment is advantageous due to larger investment avenues now open in the first place and secondly due to the imperfect correlation among the international markets. The total risk of a portfolio including the international investment will be lower than with only domestic investments. The degree of volatility, and all risk measures, indicate that these risks vary among the countries and in different degrees and the possibility of covariance, or high correlation will be low.
The frontier of efficiency portfolios can be widened, by inclusion of foreign investments in a portfolio. Thus many International Portfolio Managers prefer to invest in India and so will be the case of Indian Portfolio Managers, if they can diversify into International Investments. There are some directions however which will increase risk in such investments.
Risks in Foreign Investments:
(1) Political and social developments may create problems in an unpredictable manner.
(2) Economic and monetary policies may change to their disadvantage. Foreign exchange controls, double taxation, appropriation of foreign assets etc., stand in the way.
ADVERTISEMENTS:
(3) Risks of currency fluctuations may pose danger to larger profits depending upon the management in exchange rates. The currency risks are important because the foreign investor when he wants to take home his profits, the desired currency is his local currency, and this has to take into account the exchange rates. The gains or returns out of foreign investments might be offset by opposite and adverse movements in exchange rates. These factors create more risks.
(4) Unforeseen international developments such as wars, political and ideological conflicts etc., might create additional risks.
(5) Foreign information is difficult and foreign accounting and reporting systems differ. All the above factors make the international diversification as desirable provided some active policy of management of portfolio is preferred and even global diversification is achieved. These are factors influencing the global diversification which provide opportunities of risk hedge, due to the diversities in their economies and markets.
Thus, leaving the domestic frontiers, the foreign economies may themselves provide a picture of varying degrees of economic and business fluctuations, high and low inflation rates vis-a-vis the GDP growth rates, etc.
Thus, P/E multiple of some markets as in India may be higher than in U.S.A.
Besides, the growth rate of India is higher than in U.S.A. with the result that potential for growth is higher here. Besides EPS in different countries may vary widely and these have to be studied in terms of domestic EPS. Foreign EPS, adjusted for forward exchange rates, foreign interest rates, inflation rates vis-a-vis the GDP growth rates, so that the international investor knows which markets are attractive internationally, and he can pursue a policy of international diversification to secure offsetting of risks — that is, investment risks in Brazil, offsetting investment risks in Germany and yet the returns in total portfolios are higher, when taken back in U.S. dollars. The various markets behave with different degrees of risk/return features such that when the U.S. returns are lower, their returns may be higher in foreign markets thus reducing the total risk of portfolios including foreign investments.
ADVERTISEMENTS:
FFI’S Investment in India:
FFIs were permitted to operate in the Indian capital market since Sept., 1992, in a bid to globalise the markets. Since Jan. 1993, FII investments actually started in India. By Sept. 1998, there were 533 FFIs registered with the RBI/SEBI, operating in India. The cumulative amount of their investment upto March 1997 was more than Rs. 31,000 crores, but from 1996 the inflow slowed down and its impact is felt on the market. In a study published in RBI’s Annual Report, 1995-96 it was revealed that BSE Sensex is significantly related (y = 0.49) to lagged net investment by FFIs. Such studies are also available in World Bank studies and IMF Studies, which also revealed the significant impact of foreign flows on the capital markets of developing countries.
These flows influence the market through demand pressures, affecting the interest rates and stock prices, money supply, domestic savings and investment activity in the domestic economies.
NRI Investment in India:
NRI Investments in India can take any of the following three forms:
(a) Avenues for Personal Investment.
ADVERTISEMENTS:
(b) Direct Investment Schemes.
(c) Portfolio Investment Schemes.
A. Personal Investments Scheme:
NRI or Foreign Citizens of Indian origin can acquire any of the following investments in India without RBI’s prior permission.
These are:
Government Securities, P.O. Savings and National Plan Certificates, UTI units, and their schemes, company deposits, Mutual Fund schemes, new issues of equity, equity shares, debentures, both for repatriation and non-repatriation purposes, immovable property for residential purpose, India Development Bonds, Housing and Real estate development to the extent of even 100%.
ADVERTISEMENTS:
The Investee Company and not NRI has to take prior permission of the RBI in the above cases. Repatriation is permitted if only funds have come from NRE/ FCNR accounts and not NRO accounts. The shares of companies, their deposits and debentures and commercial paper are all available for investment on a non-repatriation basis, under this scheme.
B. Direct Investment Scheme:
There are two schemes of 40% and 100% of investment, under this category. 40% scheme is for investment in shares and debentures in companies engaged in Industrial and manufacturing activity, Hotels, Hospitals, Shipping Companies, Computer Software, oil exploration, etc. There is no ceiling on the amount of remittable dividend, but the investee company has to take the RBI permission in this regard.
100% scheme is for Real Estate Development, Township development, Construction of residential buildings, houses etc., development of roads, building materials, bridges and infrastructure facilities, house finance and Air Taxi operators. They can invest upto 100% in debentures (NCDS), sick industrial undertakings without repatriation. The 100% investment is also permitted for OCBs (overseas corporate bodies with 60% participation of NRIs). They can make investments, in 100% export oriented units, EPZ, and high priority industries with foreign equity participation of 51% with the rest to be left (49%) to NRIs.
Original investment can be repatriated after 3 years from the date of the issue. Actual income or dividends, can be freely repatriable, subject to payment of tax (at a flat rate of 20%). OCBs are permitted to repatriate after 3 years at 16% net profit and Air Taxi operators only after 5 years and out of accumulated foreign exchange earnings only.
NRIs can invest in High priority industries listed in Annexure II to the latest statement on Industrial Policy (1991).
C. Portfolio Investment Scheme:
NRIs can freely invest and disinvest without any lock in period in the cases of the investment in Domestic Mutual Funds, without any limit, and in paid up capital and debt capital upto 5% for each individual subject to an overall ceiling of 10% for all NRIs and OCBs, which can be raised upto 24% if the company passes a Resolution to that effect in the General Body Meeting. This limit was later removed.
The ADs who have the accounts of NRIs can be used as the medium for portfolio investments on the stock exchanges. RBI’s approval is to be secured by the NRI through that particular AD. There is no lock in period and RBI’s approval is valid for 5 years. Capital gains and dividends etc., can be repatriated after payment of taxes (at a flat rate of 20%), if the funds have come through NRE and FCNR accounts.
Sale and Transfer of shares is also permitted by the RBI without prior permission in respect of Govt., securities, debentures of corporates, and those on non-repatriation basis. However, RBI’s prior permission is required for transfer to other NRIs, Residents, either by private placement or through any private agency. Those on repatriation basis require permission of the RBI. Rights entitlements and bonus issues are subject to RBI’s permission which has to be sought by the company. General permission of RBI is available only for those on non-repatriation basis.
These provisions are subject to constant changes, which are reported in the financial press on a daily basis.
Passive International Investment Strategy:
In passive strategy, an International Index fund is the ideal method of investing abroad. Thus, the offshore funds of India, or other International funds of China, Brazil, Mexico, etc., can be used as the index funds, for passive investment. They can alternatively trade in only major world markets, like U.K., Japan, Germany, France, and Switzerland, after a study of their market behaviour. This strategy of investing in balanced portfolio of a large number of countries, with a high degree of diversification may improve the returns on such positions.
Risk in a foreign portfolio in terms of standard deviation of the continuously compounded annualised return is-
Vt = [V1m2 + Vc2 + 2PVc Vlm] ½
Vc = Exchange Rate risk, V is total portfolio risk in local market terms, fully hedged, Vt = total portfolio risk in base currency terms, without currency hedging, P = correlation between exchange rate return and portfolio return in local market terms. The above formula indicates that total portfolio risk in foreign markets is lower, if there is a good negative correlation between local currency returns and local market returns in stock market.
The factors influencing such foreign portfolios are:
(i) Foreign asset local returns,
(ii) Foreign currency returns,
(iii) Domestic asset returns, and
(iv) Correlation Coefficient between these variables.
The return on a fully hedged foreign investment is-
R = Lr + Fp/d
R = Return on foreign investment fully hedged.
Lr = Local asset returns, Fp/d is the Forward Premium/discount (U.S. Short- term rate and foreign short-term rate).
Active International Investment Strategy:
Active strategy is oriented to identifying relatively attractive and unattractive national markets. Such identification is followed by ranking these markets abroad and weightage in one’s portfolio is given by such ranking in terms of the attractiveness of the local markets. This identification involves some analytical and predictive powers both in the investment markets and currency markets.
Adjust for hedging of currency rates and Market returns so that an optimum portfolio with higher return and lowest risk is built. International Rating Agencies like Moody’s provide country and currency ratings and publish investment grades of countries.
Return Forecasts:
An exercise of importance in active Portfolio Management is to forecast the returns in equity market and in currency markets.
If say the foreign equity return is 20% as against 10% of domestic return, foreign investments may look attractive but if that 20% return is lost by adverse currency rate fluctuations or high local tax rates then it is not worthwhile investing abroad.
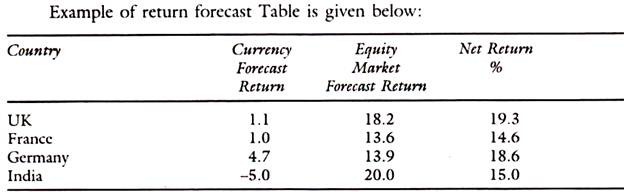
Equity market returns are high in India but tax rates and currency rate variations create negative return so that investment becomes unattractive in India, as seen from the above table. In considering various markets the Portfolio Manager takes into account various economic and political factors and not merely equity returns.
A few examples are given here:
Factors Considered:
(1) EPS market index and P/E multiple.
(2) Relative growth of the economy and the market. If market earnings growth is higher than the growth rate of GDP it is potentially good market.
(3) If the market capitalisation is low relative to GDP and potentiality of growth of MC is high, such markets are again attractive to foreign investors.
(4) Monthly volatility and annual volatility of prices, should not be very high, for attracting foreign investment.
(5) Liquidity and settlement process in the markets — whether deliveries are prompt and enough scrips are available for delivery at the international standards of T + 3 Delivery.
(6) Good floating stock of companies and wide public holding so as to promote trading in such securities in domestic markets of those countries.
(7) Free and floating currency without current and capital account controls. If the county has only capital account controls but no current account controls, it is partly attractive as in the case of India.
(8) Stable exchange rates or facilities for hedge and cover for forward exchange position are available in these markets.
If the above features are prevailing in a good measure, such countries are worthwhile and attractive for foreign portfolio Management. The breadth of the market in terms of the available number of traded companies and their floating stock are also considered in addition to the expected returns and risks involved in trading in such markets.
International diversification is desirable to improve return and reduce risks. The optimisation process with international diversification is more complicated and active investment strategy will give better returns than passive strategy. Some prior conditions should also be satisfied for optimisation process.
iii. Naive Diversification:
This refers to the diversification by simply picking stocks at random. This may or may not reduce risk to the optimum level. As the number of stocks in a portfolio is increased randomly, it is possible to reduce the risk upto a point and that too only in respect of the non-systematic risk. The market related systematic risk cannot be reduced by diversification. Naive diversification is thus diversification without any benefits.
Evans & Archers’ Study:
Evans & Archer studied the data of 470 NYSE firms during 1958-67 and showed that if the maximum risk of a single stock is 21%, it can be reduced to the extent of approximately 9% and the rest of 12% representing the systematic risk, cannot be diversified away. That is the market risk which the investor has to bear and by using the concept of Beta, he can take that much risk that he can tolerate as per his preference or aversion.

In the above chart the average standard deviation of returns for a single stock was about 21%. When portfolio is of two stocks, and only selected were formed, the average standard deviation of this portfolio is about 16%. The average standard deviation (σ) of the portfolio of three stocks was 15% and so on down the line, until, the risk is reduced upto 8 stocks in his study. Most of the diversification benefits were achieved even by the use of 8 stocks portfolio. If all the 470 stocks were grouped together into one portfolio, the standard deviation was 11.6%. Thus, in his study of470 stocks, of the total risk he reduced only upto about 9% and 12% is the systematic risk or market risk which could not be reduced.
Thus, Evans and Archer study showed the optimum level upto which risk can be lowered and that will be lower depending upon stocks chosen and the time period.
Term Paper # 4. Advantages of Diversification:
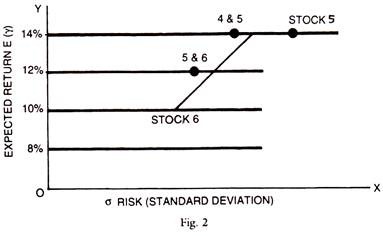
Advantages of diversification are seen in both returns and risk. Returns can be improved and risks lowered by proper diversification of securities, in those which have negative covariance or are independent. In the chart below, stocks 4, 5 and portfolio 4 & 5 are having the same expected return of 14% but the standard deviation (σ) of the portfolio 4 & 5 is less than the standard deviation of 4 or 5 alone. By combining 4 and 5 into a portfolio, the investor has reduced the risk without any loss of return.
Take stocks 5 & 6, and a portfolio of 5 8c 6. Since the return of any portfolio is the weighted average of individual security returns, the expected return of the portfolio is 12, while that of stock 5 is 14% and of Stock 6 is 10% [average is ½ (14 + 10)] = 12. But the risk or standard deviation of a portfolio is not simply a weighted average of individual securities. Standard deviation, portfolio 5 & 6 plots to the left of a straight line connecting 5 & 6 — which means that there is less risk in the Portfolio than in the weighted average combination (linear line).
Besides, the securities need not be equally weighted as in the above example. If one can design different combinations, he may reach the efficient Frontier line which has least risk for a given return.
In this chart, as seen above, returns can be improved and risk reduced by diversification. The optimum points of different combinations, giving the least risk for a given level of return will constitute the efficient frontier. Beyond the frontier line, one cannot reduce the risk further, due to diseconomies or difficulties of reducing the risk further. Reduction of risk takes place due to the fact that securities’ returns are not perfectly correlated in the portfolio.